scgraph


Supply chain graph package for Python
Documentation
Getting Started: https://github.com/connor-makowski/scgraph
Low Level: https://connor-makowski.github.io/scgraph/scgraph/core.html
Key Features
GeoGraphs:
- A geographic graph data structure that allows for the calculation of shortest paths between two points on earth
- Uses latitude / longitude pairs to represent points on earth
- Supports maritime, rail, road and other geographic networks
- Uses a sparse network data structure to represent the graph
- How to use it - Calculate the shortest path between two points on earth
- Inputs:
- A latitude / longitude pair for the origin
- A latitude / longitude pair for the destination
- Calculation:
- Algorithms:
- Dijkstra's algorithm
- Modified to support sparse network data structures
- Modified Dijkstra algorithm
- Modified for O((n+m)log(n)) performance where n is the number of nodes and m is the number of edges
- Uses a priority queue and other improvements to run fast on large graphs
- A* algorithm (Extension of the Modified Dijkstra)
- Uses a heuristic function to improve performance on large graphs
- Possible future support for other algorithms
- Returns:
path:
- A list of lists
[latitude, longitude] that make up the shortest path
length:
- The distance (in the units requested) between the two points
- Precompiled Geographs offer Antimeridian support
- Arbitrary start and end points are supported
- Start and end points do not need to be in the graph
GridGraphs:
- A grid based graph data structure that allows for the calculation of shortest paths between two points on a grid
- Supports arbitrary grid sizes and blockages
- Uses a sparse network data structure to represent the graph
- How to use it - Calculate the shortest path between two points on a grid
- Inputs:
- A (x,y) coordinate on the grid for the origin
- A (x,y) coordinate on the grid for the destination
- Calculation:
- Algorithms:
- Dijkstra's algorithm
- Modified Dijkstra algorithm
- A* algorithm (Extension of the Modified Dijkstra)
- Returns:
length:
- The distance between the two points on the grid
coordinate_path:
- A list of dicts
{"x": x, "y": y} representing the path taken through the grid
- Arbitrary start and end points are supported
- Start and end points do not need to be in the graph
- Arbitrary connection matricies are supported
- Cardinal connections (up, down, left, right) and diagonal connections (up-left, up-right, down-left, down-right) are used by default
- Custom connection matricies can be used to change the connections between grid items
- Cached shortest path calculations can be used for very fast repetative calculations to or from the same point in a GridGraph.
- Other Useful Features:
- Graph
- A low level graph object that has methods for validating graphs, calculating shortest paths, and more
- CacheGraphs
- A graph extension that caches spanning trees for fast shortest path calculations on repeat calls from the same origin node
Setup
Make sure you have Python 3.10.x (or higher) installed on your system. You can download it here.
Note: Support for python3.6-python3.9 is available up to version 2.2.0.
Installation
pip install scgraph
Use with Google Colab
Getting Started
Basic Geograph Usage
Get the shortest path between two points on earth using a latitude / longitude pair
In this case, calculate the shortest maritime path between Shanghai, China and Savannah, Georgia, USA.
from scgraph.geographs.marnet import marnet_geograph
output = marnet_geograph.get_shortest_path(
origin_node={"latitude": 31.23,"longitude": 121.47},
destination_node={"latitude": 32.08,"longitude": -81.09},
output_units='km'
)
print('Length: ',output['length'])
In the above example, the output variable is a dictionary with two keys: length and coordinate_path.
length: The distance between the passed origin and destination when traversing the graph along the shortest path
- Notes:
- This will be in the units specified by the
output_units parameter.
output_units options:
km (kilometers - default)m (meters)mi (miles)ft (feet)
coordinate_path: A list of lists [latitude,longitude] that make up the shortest path
For more examples including viewing the output on a map, see the example notebook.
Included GeoGraphs
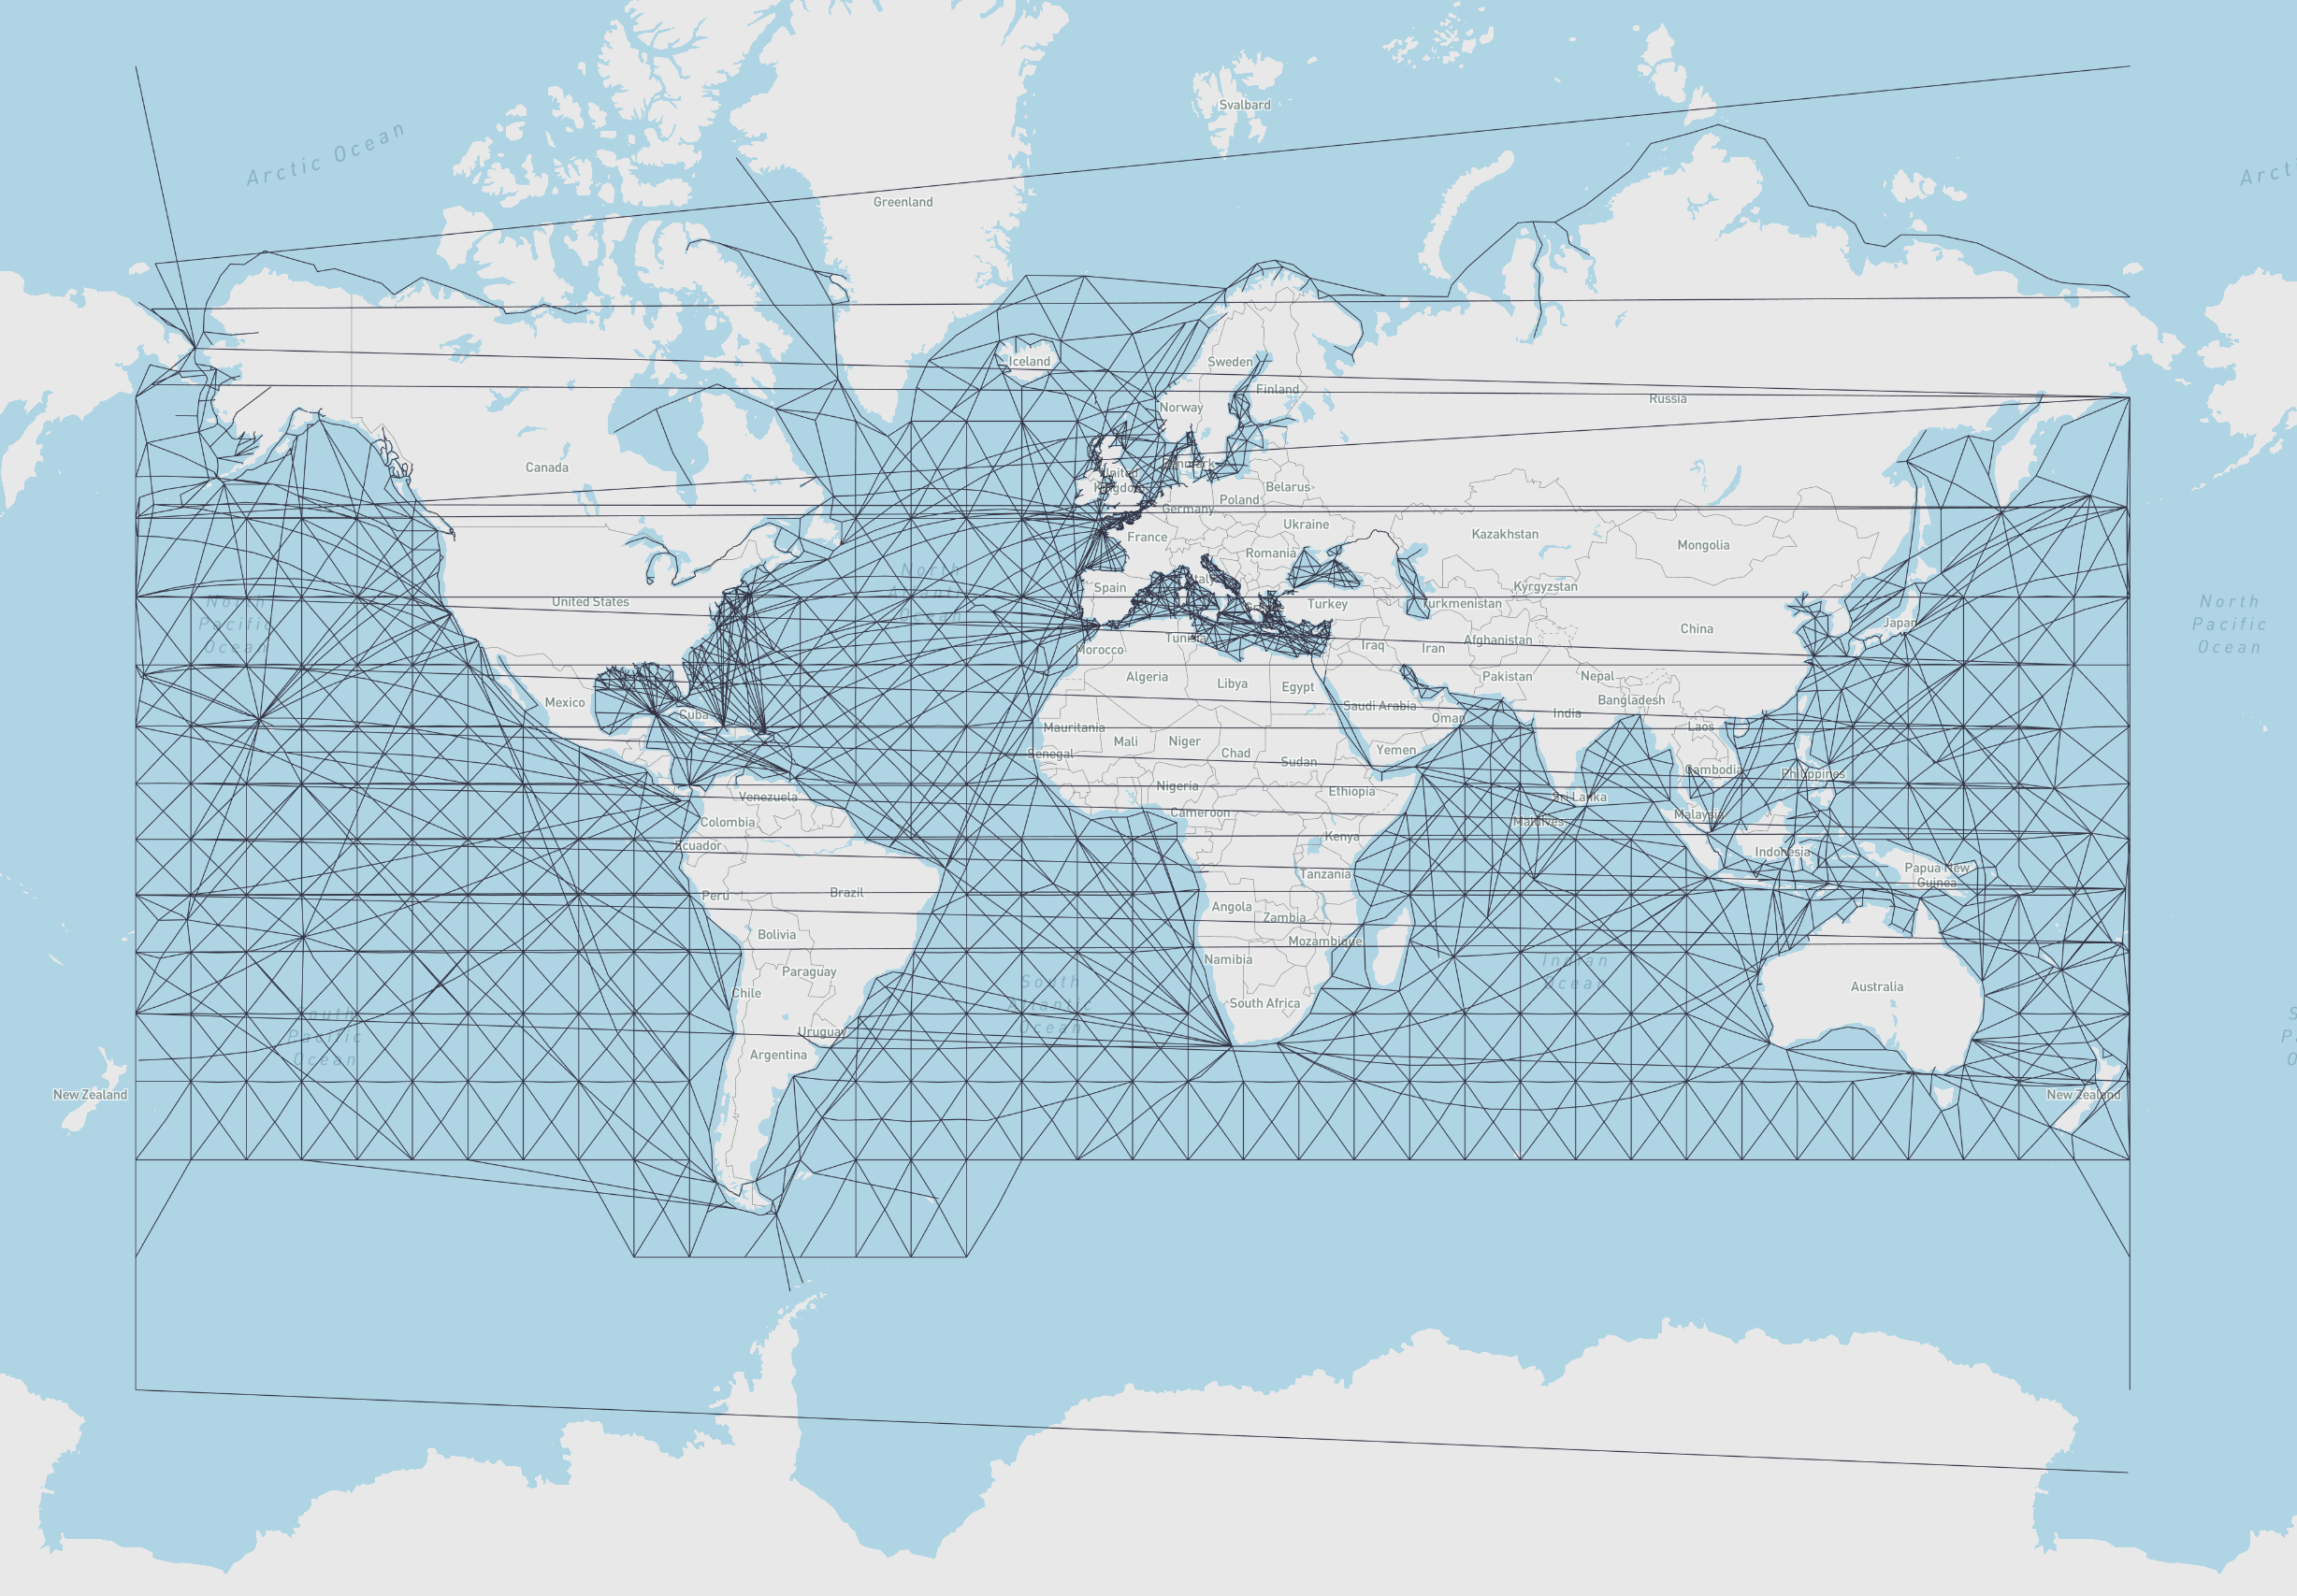
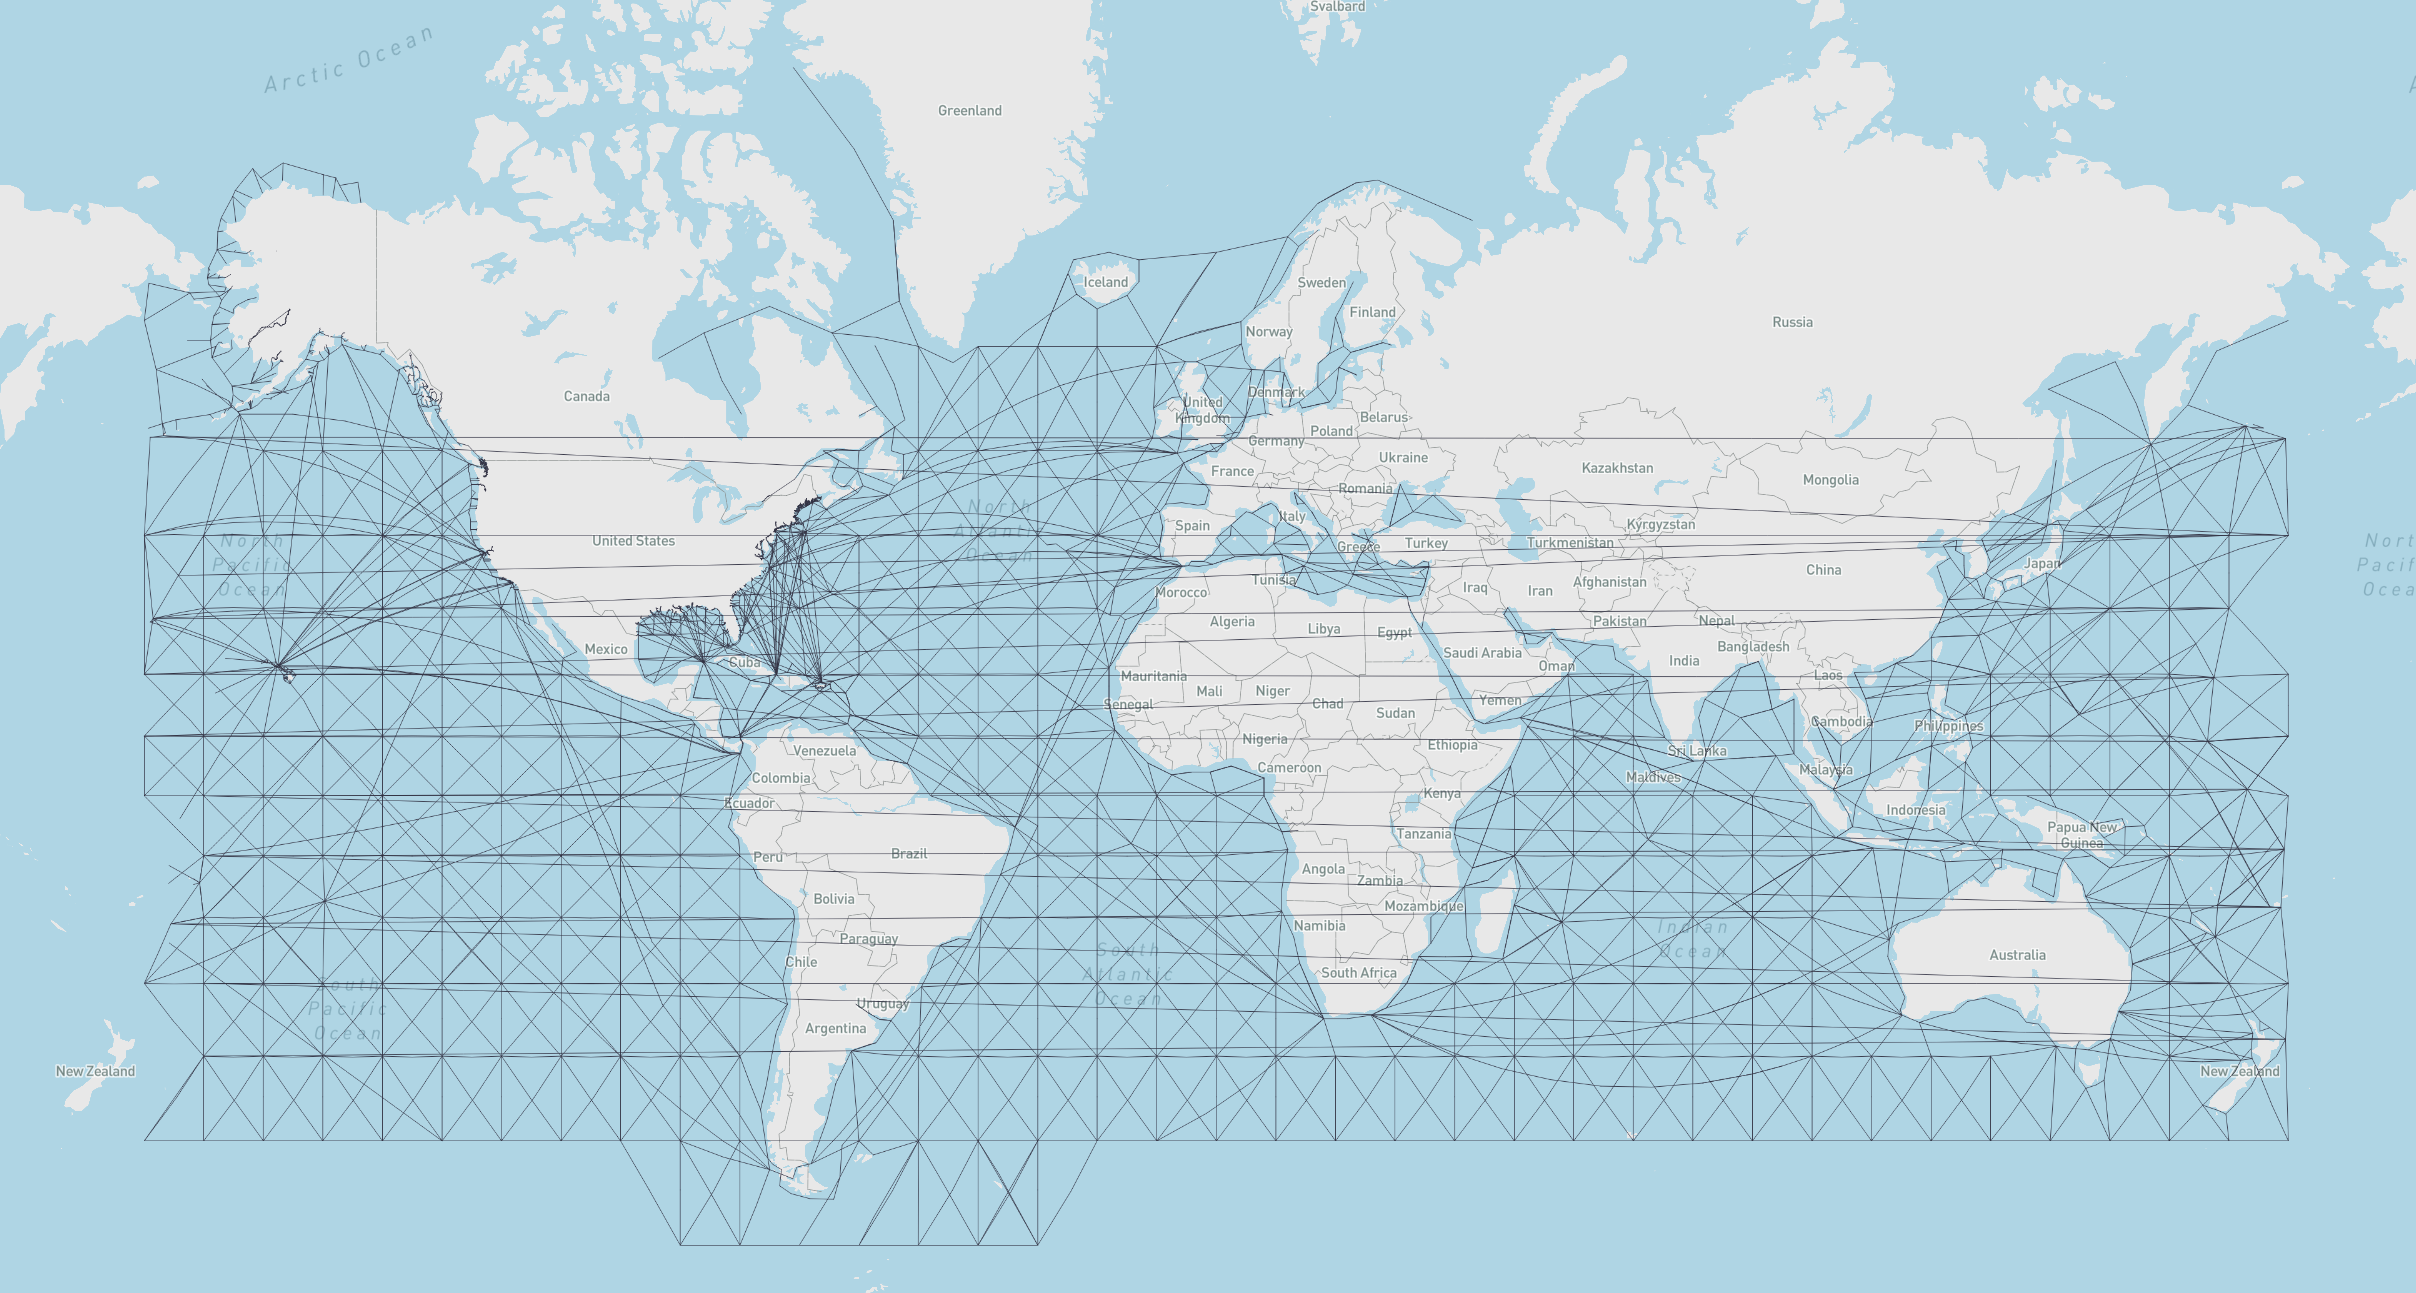
- marnet_geograph:
- What: A maritime network data set from searoute
- Use:
from scgraph.geographs.marnet import marnet_geograph
- Attribution: searoute
- Length Measurement: Kilometers
- Marnet Picture
- oak_ridge_maritime_geograph:
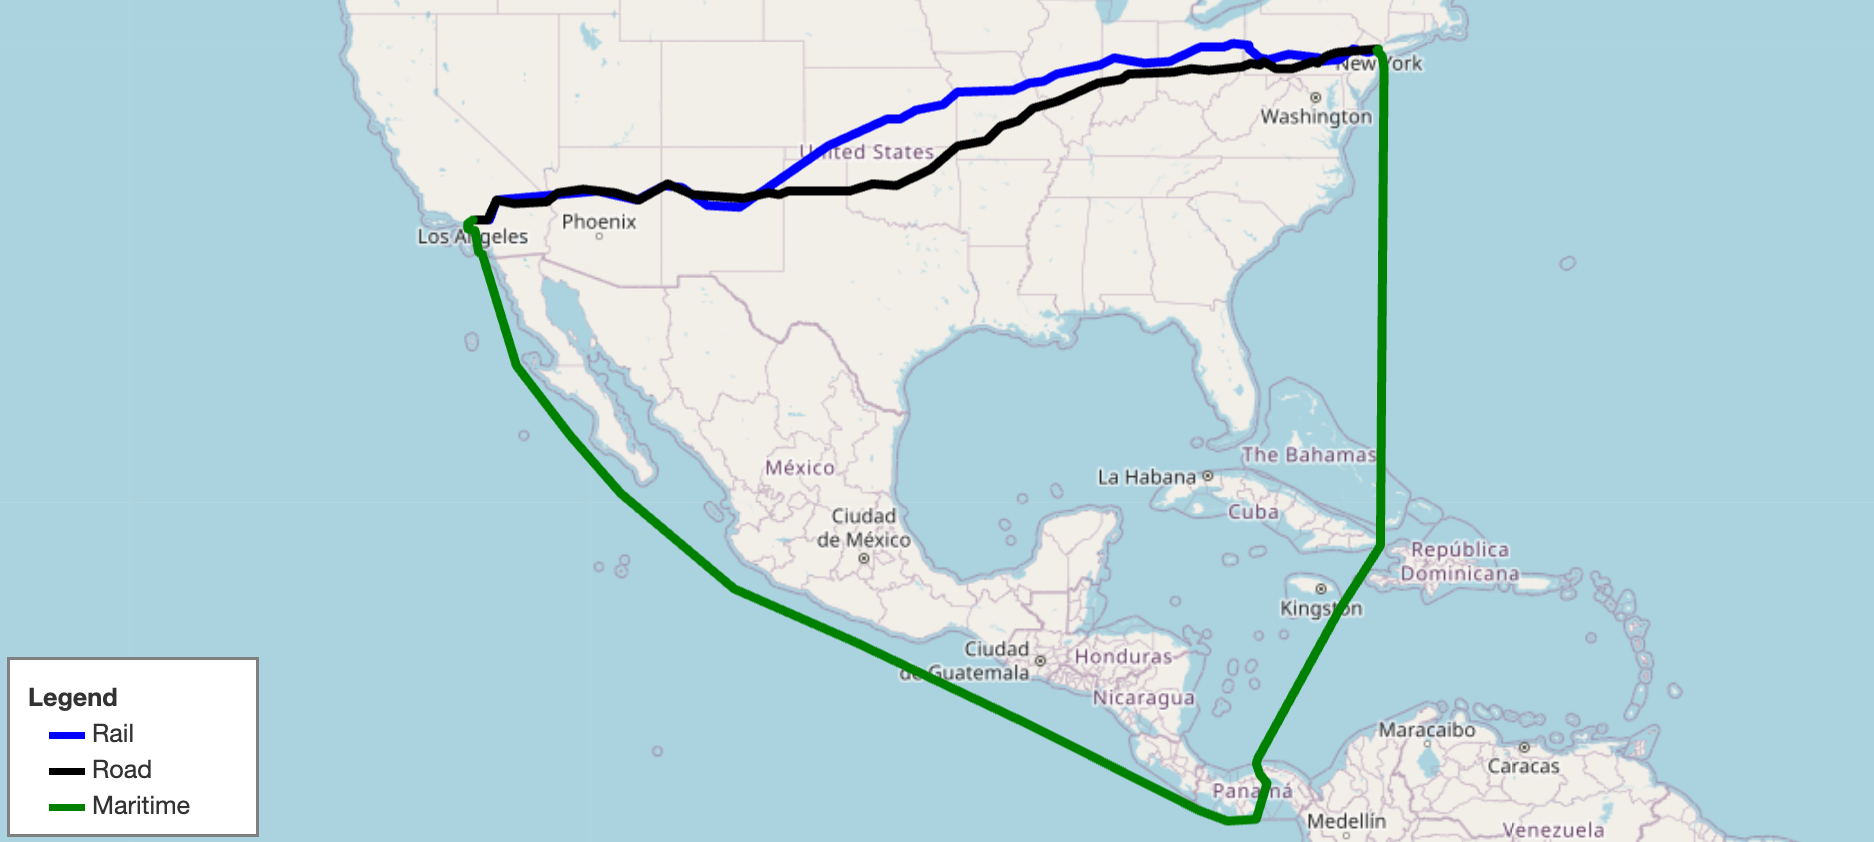
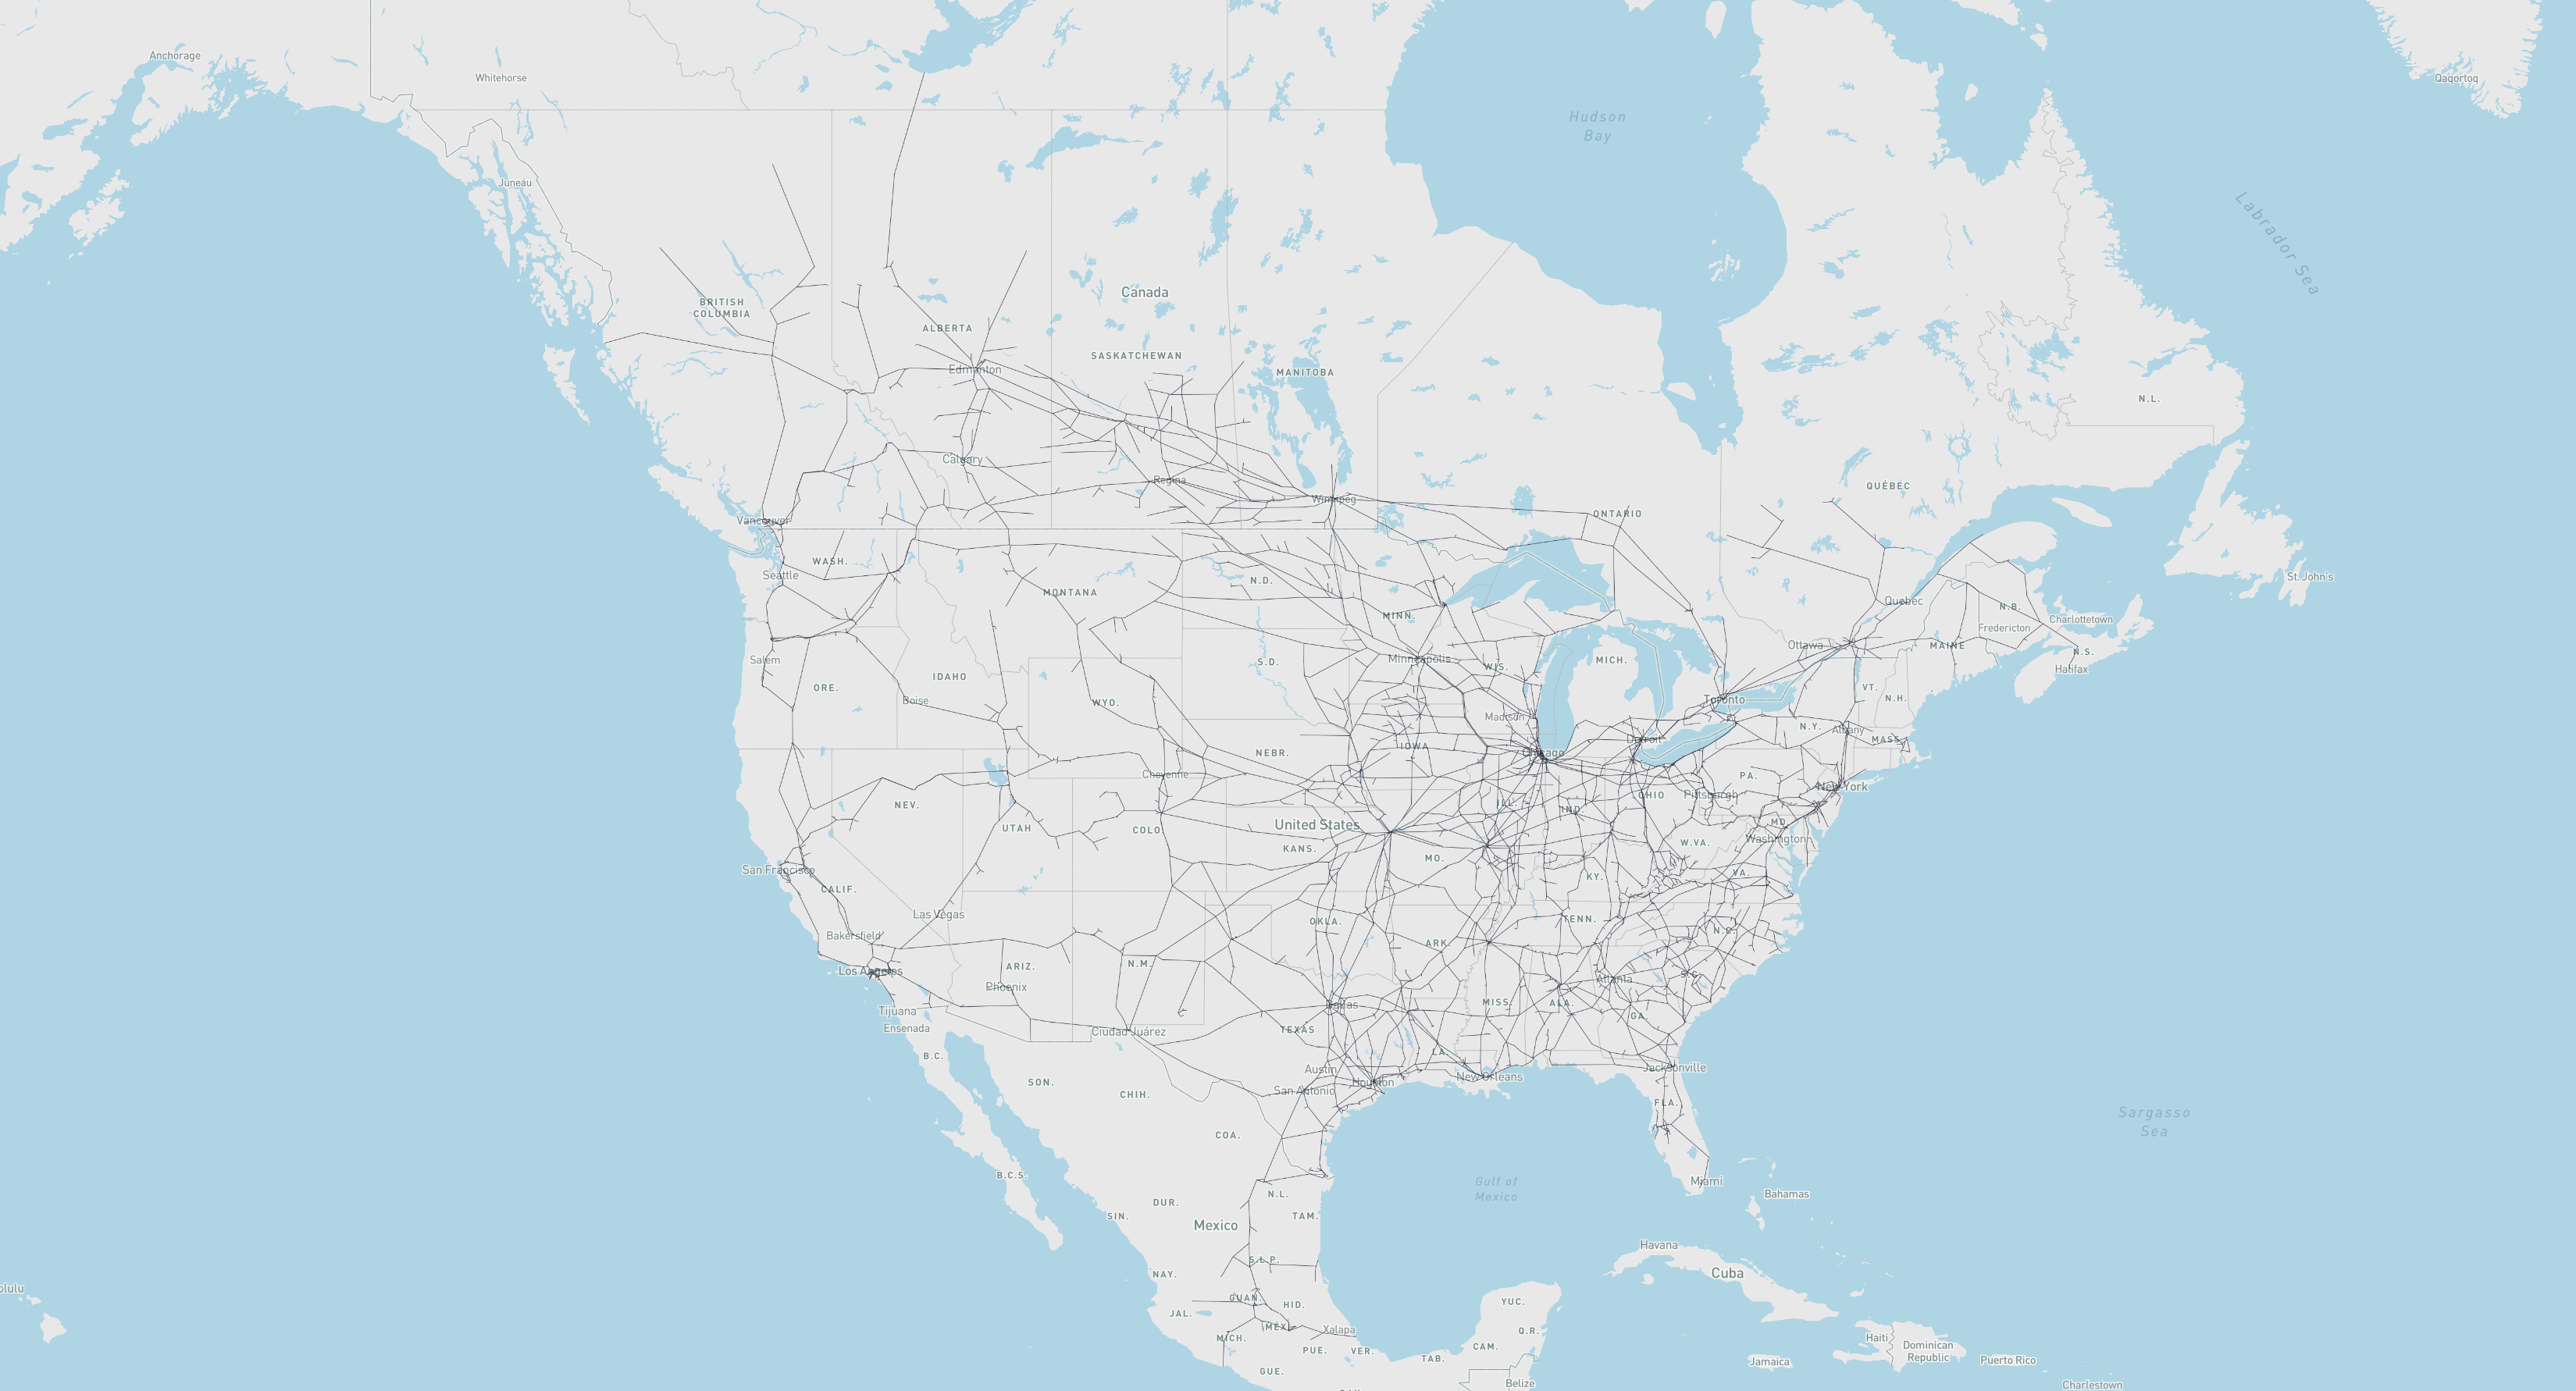
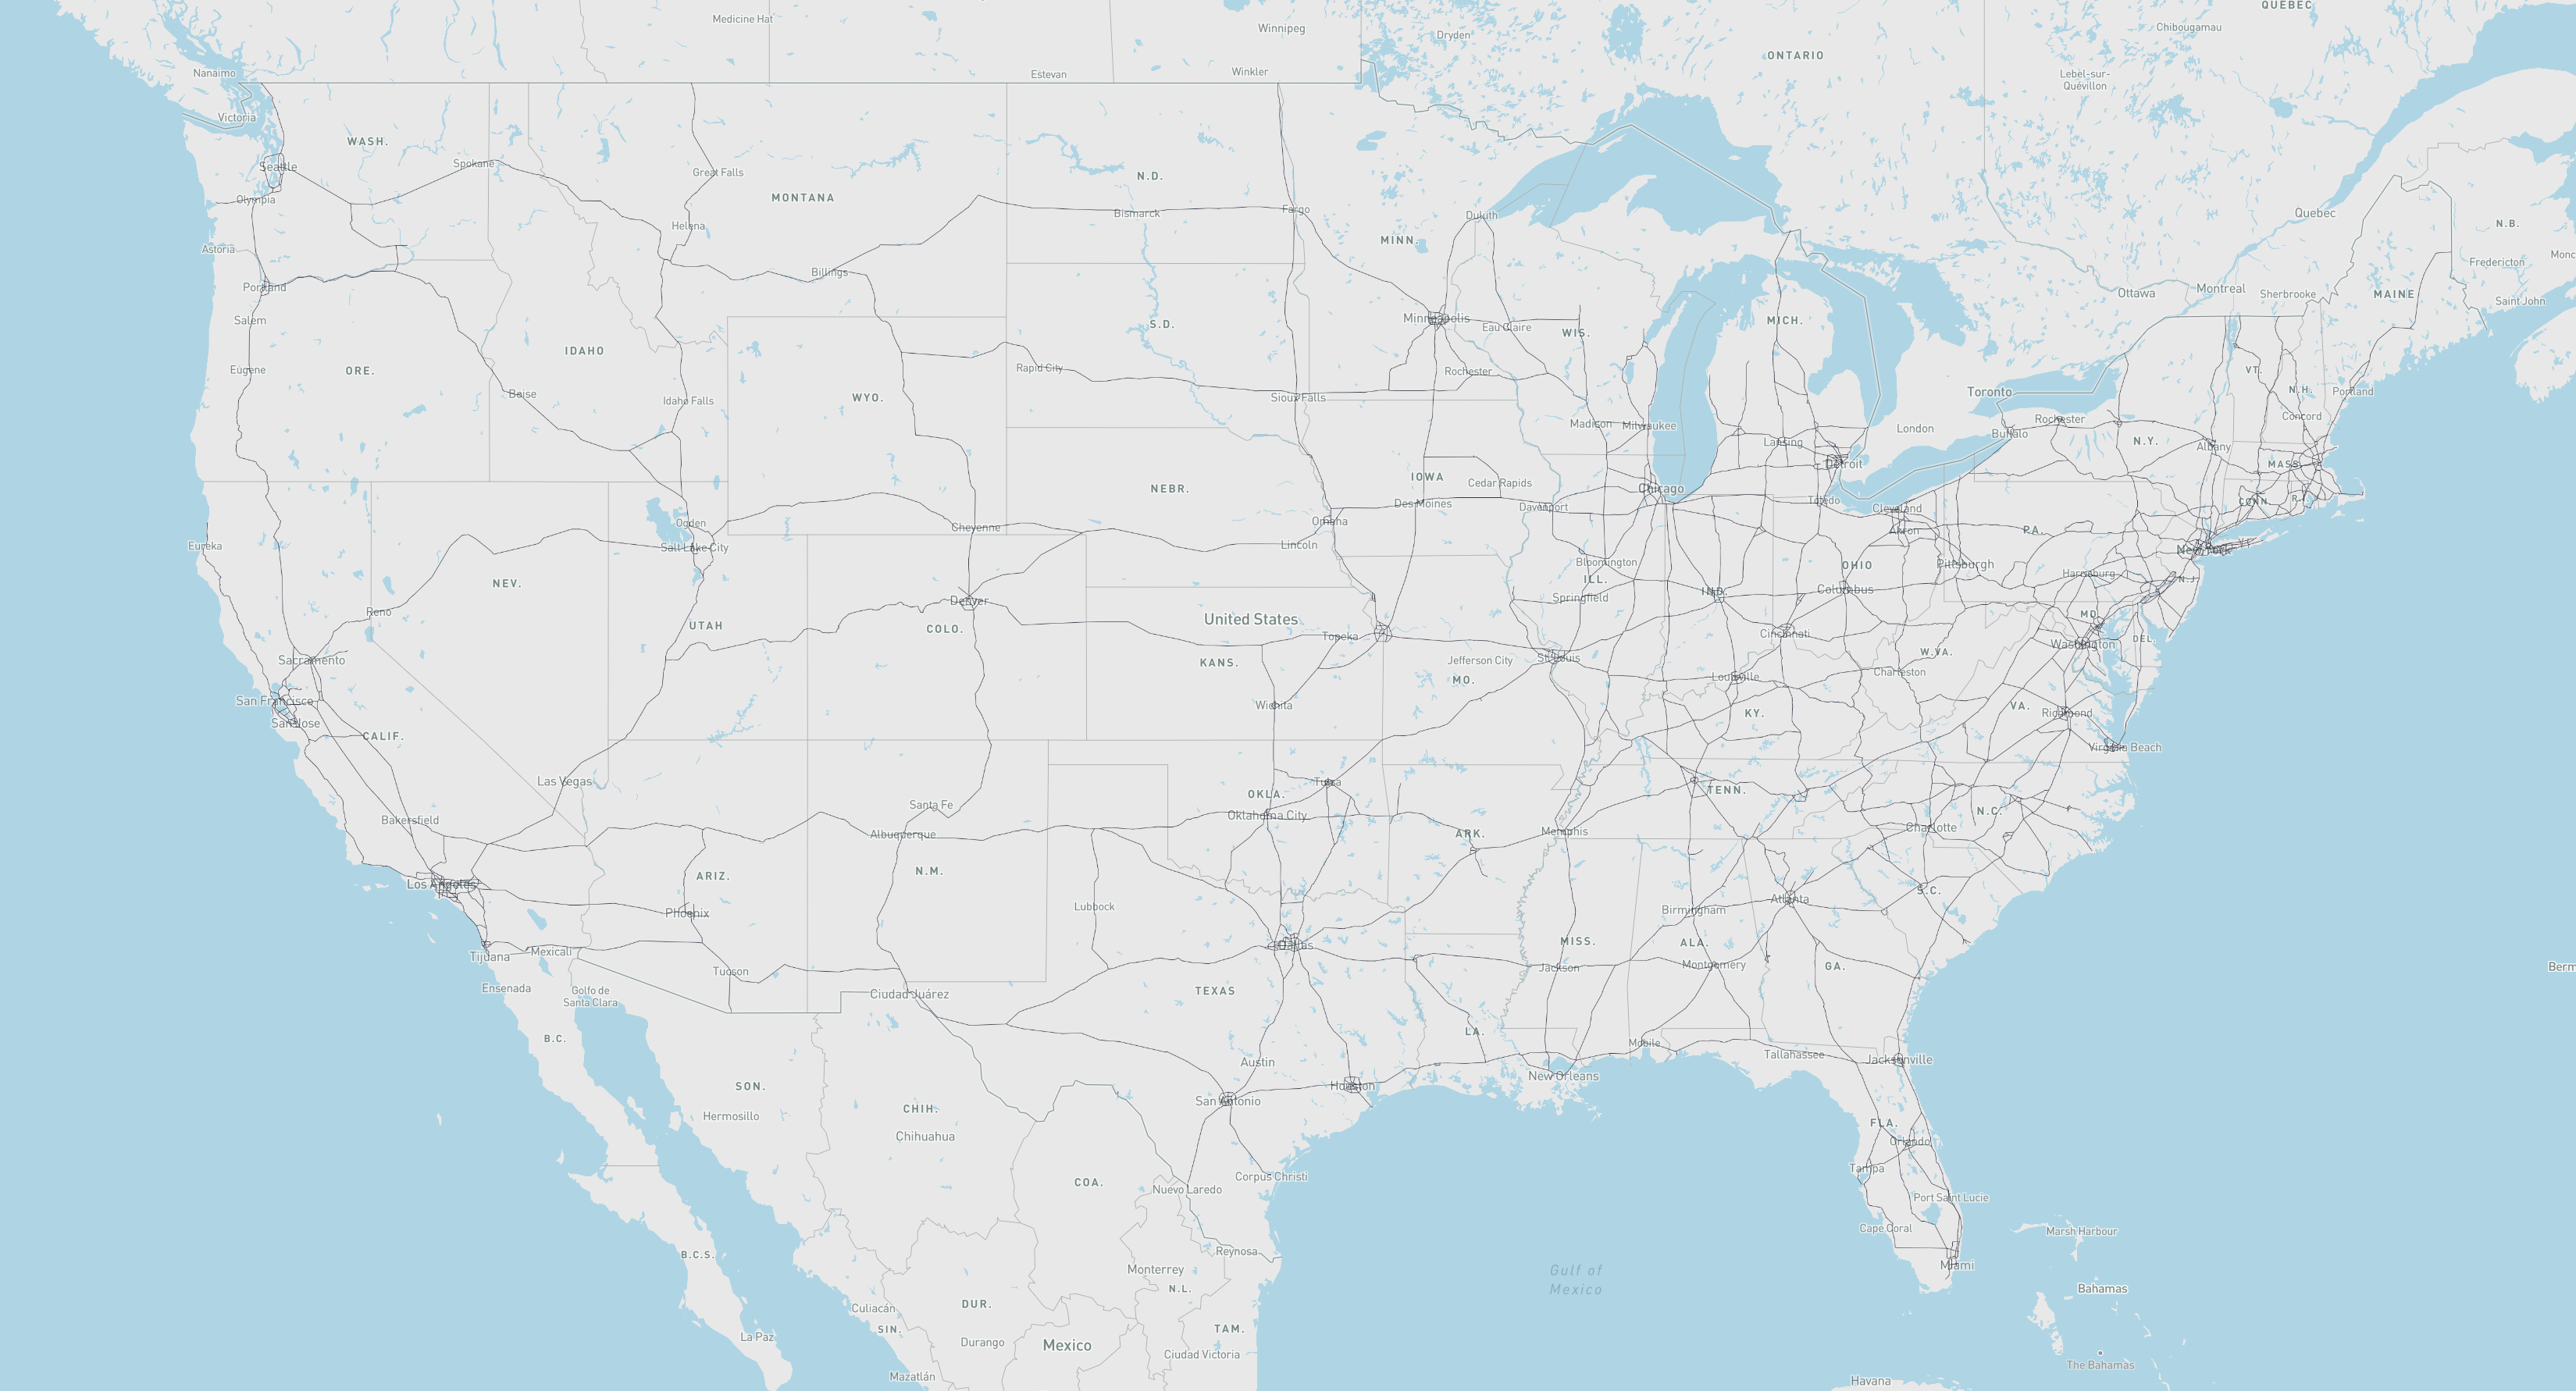
- north_america_rail_geograph:
- us_freeway_geograph:
scgraph_data geographs:
- What: Additional geographs are available in the
scgraph_data package
- Note: These include larger geographs like the world highways geograph and world railways geograph.
- Installation:
pip install scgraph_data
- Use:
from scgraph_data.world_highways import world_highways_geograph
- See: scgraph_data for more information and all available geographs.
GridGraph usage
Example:
- Create a grid of 20x20 cells.
- This creates a grid based graph with connections to all 8 neighbors for each grid item.
- Each grid item has 4 cardinal connections at length 1 and 4 diagonal connections at length sqrt(2)
- Create a wall from (10,5) to (10,19).
- This would foce any path to go to the bottom of the graph to get around the wall.
- Get the shortest path between (2,10) and (18,10)
- Note: The length of this path should be 16 without the wall and 20.9704 with the wall.
from scgraph import GridGraph
x_size = 20
y_size = 20
blocks = [(10, i) for i in range(5, y_size)]
gridGraph = GridGraph(
x_size=x_size,
y_size=y_size,
blocks=blocks,
add_exterior_walls=True,
)
output = gridGraph.get_shortest_path(
origin_node={"x": 2, "y": 10},
destination_node={"x": 18, "y": 10},
output_coordinate_path="list_of_lists",
cache=True,
cache_for="origin",
)
print(output)
Advanced Usage
Using scgraph_data geographs
Using scgraph_data geographs:
- Note: Make sure to install the
scgraph_data package before using these geographs
from scgraph_data.world_railways import world_railways_geograph
from scgraph import Graph
output = world_railways_geograph.get_shortest_path(
origin_node={"latitude": 42.29,"longitude": -85.58},
destination_node={"latitude": 42.33,"longitude": -83.05},
algorithm_fn=Graph.a_star,
algorithm_kwargs={"heuristic_fn": world_railways_geograph.haversine},
)
Using Geographs for Visualization
Get a geojson line path of an output for easy visualization:
- Note:
mapshaper.org and geojson.io are good tools for visualizing geojson files
from scgraph.geographs.marnet import marnet_geograph
from scgraph.utils import get_line_path
output = marnet_geograph.get_shortest_path(
origin_node={"latitude": 7.87,"longitude": 80.77},
destination_node={"latitude": 5.15,"longitude": 46.20}
)
get_line_path(output, filename='output.geojson')
Custom Graphs and Geographs
Modify an existing geograph: See the notebook here
You can specify your own custom graphs for direct access to the solving algorithms. This requires the use of the low level Graph class
from scgraph import Graph
graph = [
{1: 5, 2: 1},
{0: 5, 2: 2, 3: 1},
{0: 1, 1: 2, 3: 4, 4: 8},
{1: 1, 2: 4, 4: 3, 5: 6},
{2: 8, 3: 3},
{3: 6}
]
Graph.validate_graph(graph=graph)
output = Graph.dijkstra_makowski(graph=graph, origin_id=0, destination_id=5)
You can also use a slightly higher level GeoGraph class to work with latitude / longitude pairs
from scgraph import GeoGraph
nodes = [
[51.5074, -0.1278],
[48.8566, 2.3522],
[52.5200, 13.4050],
[41.9028, 12.4964],
[40.4168, -3.7038],
[38.7223, -9.1393]
]
graph = [
{
1: 311,
},
{
0: 311,
2: 878,
3: 1439,
4: 1053
},
{
1: 878,
3: 1181,
},
{
1: 1439,
2: 1181,
},
{
1: 1053,
5: 623
},
{
4: 623
}
]
my_geograph = GeoGraph(nodes=nodes, graph=graph)
my_geograph.validate_graph()
my_geograph.validate_nodes()
output = my_geograph.get_shortest_path(
origin_node = {'latitude': 52.4862, 'longitude': -1.8904},
destination_node = {'latitude': 41.6488, 'longitude': -0.8891}
)
print(output)
Development
Running Tests, Prettifying Code, and Updating Docs
Make sure Docker is installed and running on a Unix system (Linux, MacOS, WSL2).
-
Create a docker container and drop into a shell
-
Run all tests (see ./utils/test.sh)
-
Prettify the code (see ./utils/prettify.sh)
-
Update the docs (see ./utils/docs.sh)
-
Note: You can and should modify the Dockerfile to test different python versions.
Attributions and Thanks
Originally inspired by searoute including the use of one of their datasets that has been modified to work properly with this package.


