Research
Security News
Lazarus Strikes npm Again with New Wave of Malicious Packages
The Socket Research Team has discovered six new malicious npm packages linked to North Korea’s Lazarus Group, designed to steal credentials and deploy backdoors.
This is the PyPI package of the simple-graph implementation in Python, which is a simple graph database in SQLite, inspired by "SQLite as a document database".
How to generate the distribution archive and confirm it on test.pypi.org, also based on the pypa/sampleproject:
rm -rf build dist src/simple_graph_sqlite.egg-info
python -m build
python -m twine upload --repository testpypi dist/*
Create a virtual environment for the test package, activate it, pull from test.pypi.org (the --extra-index-url is necessary since the graphviz and/or Jinja2 dependencies may not be in the test archive), and confirm the package is available:
$ pip install -i https://test.pypi.org/simple/ --extra-index-url https://pypi.org/simple simple-graph-sqlite graphviz==0.16 Jinja2==3.1.2
$ python
Python 3.6.13 |Anaconda, Inc.| (default, Jun  4 2021, 14:25:59)
[GCC 7.5.0] on linux
Type "help", "copyright", "credits" or "license" for more information.
>>> from simple_graph_sqlite import database as db
With the test package installed, update PYTHONPATH to include ./tests and run pytest from the root of this repository. If the tests pass, rebuild and push to pypi.org:
rm -rf build dist src/simple_graph_sqlite.egg-info
python -m build
python -m twine upload --repository pypi dist/*
The schema consists of just two structures:
id valueid values, specifying the direction, with an optional json object as connection propertiesThere are also traversal functions as native SQLite Common Table Expressions:
The database script provides convenience functions for atomic transactions to add, delete, connect, and search for nodes.
Any single node or path of nodes can also be depicted graphically by using the visualize function within the database script to generate dot files, which in turn can be converted to images with Graphviz.
Dropping into a python shell, we can create, upsert, and connect people from the early days of Apple Computer. The resulting database will be saved to a SQLite file named apple.sqlite:
>>> apple = "apple.sqlite"
>>> from simple_graph_sqlite import database as db
>>> db.initialize(apple)
>>> db.atomic(apple, db.add_node({'name': 'Apple Computer Company', 'type':['company', 'start-up'], 'founded': 'April 1, 1976'}, 1))
>>> db.atomic(apple, db.add_node({'name': 'Steve Wozniak', 'type':['person','engineer','founder']}, 2))
>>> db.atomic(apple, db.add_node({'name': 'Steve Jobs', 'type':['person','designer','founder']}, 3))
>>> db.atomic(apple, db.add_node({'name': 'Ronald Wayne', 'type':['person','administrator','founder']}, 4))
>>> db.atomic(apple, db.add_node({'name': 'Mike Markkula', 'type':['person','investor']}, 5))
>>> db.atomic(apple, db.connect_nodes(2, 1, {'action': 'founded'}))
>>> db.atomic(apple, db.connect_nodes(3, 1, {'action': 'founded'}))
>>> db.atomic(apple, db.connect_nodes(4, 1, {'action': 'founded'}))
>>> db.atomic(apple, db.connect_nodes(5, 1, {'action': 'invested', 'equity': 80000, 'debt': 170000}))
>>> db.atomic(apple, db.connect_nodes(1, 4, {'action': 'divested', 'amount': 800, 'date': 'April 12, 1976'}))
>>> db.atomic(apple, db.connect_nodes(2, 3))
>>> db.atomic(apple, db.upsert_node(2, {'nickname': 'Woz'}))
There are also bulk operations, to insert and connect lists of nodes in one transaction.
The nodes can be searched by their ids:
>>> db.atomic(apple, db.find_node(1))
{'name': 'Apple Computer Company', 'type': ['company', 'start-up'], 'founded': 'April 1, 1976', 'id': 1}
Searches can also use combinations of other attributes, both as strict equality, or using LIKE in combination with a trailing % for "starts with" or % at both ends for "contains":
>>> db.atomic(apple, db.find_nodes([db._generate_clause('name', predicate='LIKE')], ('Steve%',)))
[{'name': 'Steve Wozniak', 'type': ['person', 'engineer', 'founder'], 'id': 2, 'nickname': 'Woz'}, {'name': 'Steve Jobs', 'type': ['person', 'designer', 'founder'], 'id': 3}]
>>> db.atomic(apple, db.find_nodes([db._generate_clause('name', predicate='LIKE'), db._generate_clause('name', predicate='LIKE', joiner='OR')], ('%Woz%', '%Markkula',)))
[{'name': 'Steve Wozniak', 'type': ['person', 'engineer', 'founder'], 'id': 2, 'nickname': 'Woz'}, {'name': 'Mike Markkula', 'type': ['person', 'investor'], 'id': 5}]
More complex queries to introspect the json body, using the sqlite json_tree() function, are also possible, such as this query for every node whose type array contains the value founder:
>>> db.atomic(apple, db.find_nodes([db._generate_clause('type', tree=True)], ('founder',), tree_query=True, key='type'))
[{'name': 'Steve Wozniak', 'type': ['person', 'engineer', 'founder'], 'id': 2, 'nickname': 'Woz'}, {'name': 'Steve Jobs', 'type': ['person', 'designer', 'founder'], 'id': 3}, {'name': 'Ronald Wayne', 'type': ['person', 'administrator', 'founder'], 'id': 4}]
See the _generate_clause() and _generate_query() functions in database.py for usage hints.
Paths through the graph can be discovered with a starting node id, and an optional ending id; the default neighbor expansion is nodes connected nodes in either direction, but that can changed by specifying either find_outbound_neighbors or find_inbound_neighbors instead:
>>> db.traverse(apple, 2, 3)
['2', '1', '3']
>>> db.traverse(apple, 4, 5)
['4', '1', '2', '3', '5']
>>> db.traverse(apple, 5, neighbors_fn=db.find_inbound_neighbors)
['5']
>>> db.traverse(apple, 5, neighbors_fn=db.find_outbound_neighbors)
['5', '1', '4']
>>> db.traverse(apple, 5, neighbors_fn=db.find_neighbors)
['5', '1', '2', '3', '4']
Any path or list of nodes can rendered graphically by using the visualize function. This command produces dot files, which are also rendered as images with Graphviz:
>>> from visualizers import graphviz_visualize
>>> graphviz_visualize(apple, 'apple.dot', [4, 1, 5])
The resulting text file also comes with an associated image (the default is png, but that can be changed by supplying a different value to the format parameter)
The default options include every key/value pair (excluding the id) in the node and edge objects, and there are display options to help refine what is produced:
>>> graphviz_visualize(apple, 'apple.dot', [4, 1, 5], exclude_node_keys=['type'], hide_edge_key=True)
The resulting dot file can be edited further as needed; the dot guide has more options and examples.
FAQs
A simple graph database in SQLite
We found that simple-graph-sqlite demonstrated a healthy version release cadence and project activity because the last version was released less than a year ago. It has 1 open source maintainer collaborating on the project.
Did you know?

Socket for GitHub automatically highlights issues in each pull request and monitors the health of all your open source dependencies. Discover the contents of your packages and block harmful activity before you install or update your dependencies.

Research
Security News
The Socket Research Team has discovered six new malicious npm packages linked to North Korea’s Lazarus Group, designed to steal credentials and deploy backdoors.

Security News
Socket CEO Feross Aboukhadijeh discusses the open web, open source security, and how Socket tackles software supply chain attacks on The Pair Program podcast.

Security News
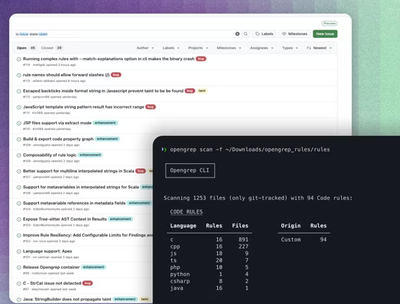
Opengrep continues building momentum with the alpha release of its Playground tool, demonstrating the project's rapid evolution just two months after its initial launch.