Chartx
Chartx is a Ruby gem helps you to develop fancy interactive data visualizations with one line of Ruby code!:)
It's a ruby wrapper of nvd3, which is an attempt to build re-usable charts and chart components for d3.js without taking away the power that d3.js gives you.
Installation
To include Chartx into your rails project, add this line to your application's Gemfile:
gem 'chartx'
And then execute:
$ bundle install
To add the necessary javascript files into your asset pipeline add
//= require chartx-core
//= require chartx-model
in app/assets/javascripts/application.js
If you only need a subset of models e.g. lineChart you can add
//= require nvd3/lib/d3.v2
//= require nvd3/src/core
//= require nvd3/src/tooltip
//= require nvd3/src/utils.js
//= require nvd3/src/models/lineChart
//= require nvd3/src/models/legend.js
//= require nvd3/src/models/axis.js
//= require nvd3/src/models/scatter.js
//= require nvd3/src/models/line.js
to your application.js. All the models can be found in https://github.com/xianhengma/nvd3/tree/chartx-branch/src/models
Examples
Pie Chart:
<%= pie_chart @pie_data %>

Line Chart:
<%= line_chart @line_data %>

Discrete Bar Chart:
<%= discrete_bar_chart @discrete_bar_data %>

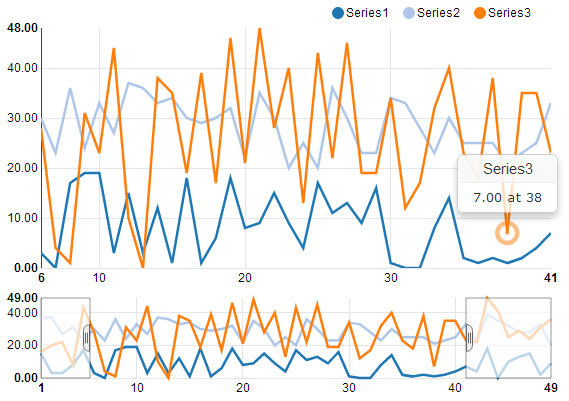
Line Chart with Focus (View Finder):
<%= line_with_focus_chart @line_with_focus_data %>
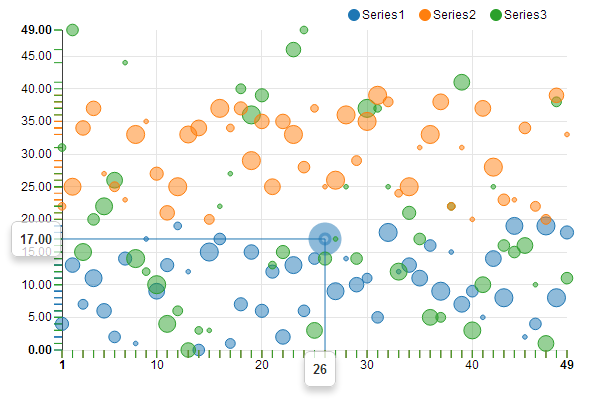
Scatter Chart:
<%= scatter_chart @scatter_data %>
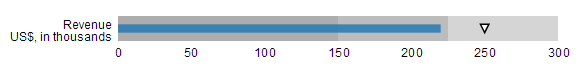
Bullet Chart:
<%= bullet_chart @bullet_data %>
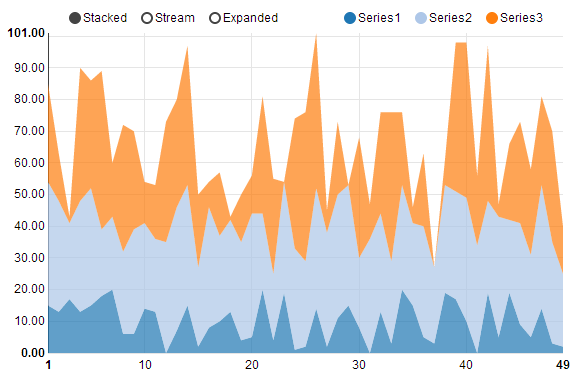
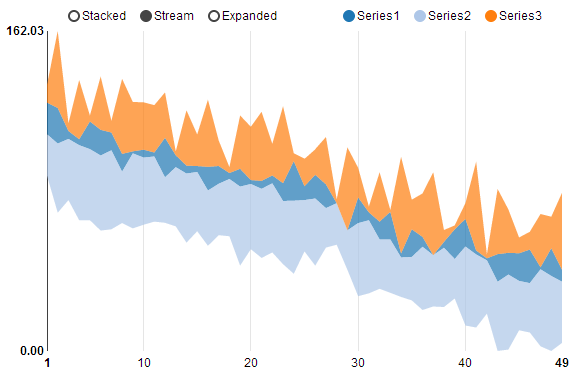
Stacked Area Bar Chart:
<%= stacked_area_chart @stacked_area_data %>
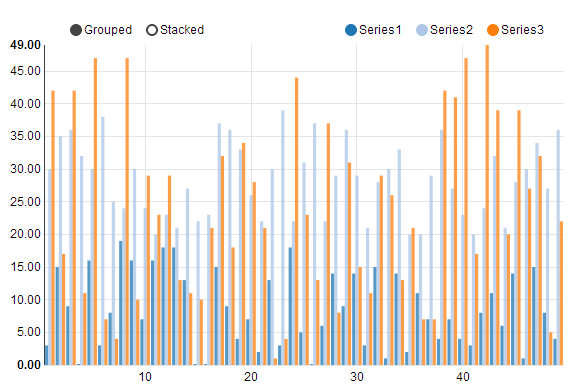
Multi Bar Chart:
<%= multi_bar_chart @multi_bar_data %>
Multi Horizontal Bar Chart:
<%= multi_bar_horizontal_chart @multi_bar_horizontal_data %>

Data Format
Data for Chartx (except Pie Chart) are in the following format:
@data = [
	{
		:key => "<Series name>",
		:color => "<CSS color>"
		:values => [
			{:label => 0, :value => 10},
			{:label => 1, :value => 20},
			{:label => 2, :value => 30}
			....
		]
	},
	{
		key: "<Series name>"
		...
	}
]
Data for Pie Chart is in the following format:
@data = [
	{
		:label => "<name1>",
		:value => 31
	},
	{
		:label => "<name2>",
		:value => 31

	},
	{
		...
	}

]
Contributing
- Fork it
- Create your feature branch (
git checkout -b my-new-feature)
- Commit your changes (
git commit -am 'Add some feature')
- Push to the branch (
git push origin my-new-feature)
- Create new Pull Request