Security News
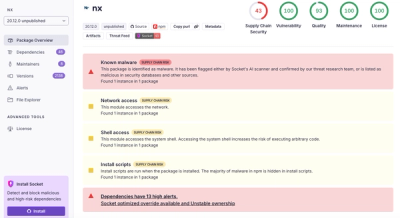
Nx npm Packages Compromised in Supply Chain Attack Weaponizing AI CLI Tools
Malicious Nx npm versions stole secrets and wallet info using AI CLI tools; Socket’s AI scanner detected the supply chain attack and flagged the malware.
Rails Mini Profiler is an easy-to-use performance profiler for your Rails applications. It is heavily inspired by Rack Mini Profiler and other APM tools. To find out how it stacks up against those check out Why Rails Mini Profiler?
To see it in action view the preview below:
Note: This gem is in early development and I'm looking for contributors. Try it out and leave some feedback, it really goes a long way in helping me out with development. Any feature request or bug report is welcome. If you like this project, leave a star to show your support! ⭐
Add Rails Mini Profiler to your Gemfile:
gem 'rails_mini_profiler'
Install the gem and run the installer:
bundle install
rails rails_mini_profiler:install
Inspect the generated migration in db/migrate and run it:
rails db:migrate
Start your Rails application and perform some requests. You can either click the little hedgehog 🦔 on the top
left or navigate to /rails_mini_profiler to view collected performance metrics.
Rails Mini Profiler provides detailed information about your requests to help you figure out why certain requests perform poorly.
Installing it will generate a new initializer config/initializers/rails_mini_profiler.rb and add a new
route:
# routes.rb
Rails.application.routes.draw do
  mount RailsMiniProfiler::Engine => '/rails_mini_profiler'
end
Once you perform requests against your applications you can inspect them using that route, or by clicking the badge on the top right that is injected into your pages.

Requests to your application will be profiled automatically. You can view and search all stored requests by navigating to yourapp/rails_mini_profiler/profiled_requests.


This view shows you how your requests spend their time. How much of it is spent in the DB, how much in rendering views? May can filter and clicking on individual traces to gain deeper insights and see detailed information.
Rails Mini Profiler automatically records Flamegraphs for profiled requests. To enable this feature, add Stackprof to your Gemfile:
gem 'stackprof'
For convenience, Flamegraphs are recorded for every request. This may incur a significant performance penalty. To change the default behavior see Configuration.
Flamegraphs are rendered using Speedscope. See Troubleshooting if Flamegraphs are not rendering correctly.
Rails Mini Profiler provides a wide array of configuration options. You can find details below. For an example configuration check initializers/rails_mini_profiler.rb (or the template file).
| Name | Default | Description |
|---|---|---|
enabled | true (dev)/ false (prod) | Whether or not RMP is enabled |
flamegraph_enabled | true | Should flamegraphs be recorded automatically? |
flamegraph_sample_rate | 0.5 | The flamegraph sample rate. How many snapshots per millisecond are created. |
skip_paths | [] | An array of request paths that should not be profiled. Regex allowed. |
storage | Storage.new | Storage configuration. See Storage. |
ui | UserInterface.new | UI configuration. See UI. |
user_provider | Rack::Request.new(env).ip | How to identify users. See Authorization |
Rails Mini Profiler stores profiling information in your database per default. You can configure various details of how traces and requests are stored.
| Name | Default | Description |
|---|---|---|
database | nil | Set a custom database to be used for storing profiler information. Uses connect_to for profiler records |
profiled_requests_table | rmp_profiled_requests | The table to be used to store profiled requests. |
flamegraphs_table | rmp_flamegraphs | The table to be used to store flamegraphs. |
traces_table | rmp_traces | The table to be used to store traces. |
Rails Mini Profiler does not offer an automatic way to clean up old profiling information. It is recommended you add a sweeper job to clean up old profiled requests periodically (e.g. using clockwork. For example, with ActiveJob:
# Clockwork
every(1.month, 'purge rails mini profiler') do
    ProfiledRequestCleanupJob.perform_later
end

# ActiveJob
class ProfiledRequestCleanupJob < ApplicationJob
  queue_as :default

  def perform
    RailsMiniProfiler::ProfiledRequest.where('created_at < ?', 1.month.ago).destroy_all
  end
end
Rails Mini Profiler allows you to configure various UI features.
| Name | Default | Description |
|---|---|---|
badge_enabled | true | Should the hedgehog 🦔 badge be injected into pages? |
badge_position | 'top-left' | Where to display the badge. Options are 'top-left', 'top-right', 'bottom-left, 'bottom-right' |
base_controller | ApplicationController | Which controller UI controllers should inherit from. |
page_size | 25 | The page size for lists shown in the UI. |
webpacker_enabled | true | Use Webpacker if available? Disable to fall back to the asset pipeline. |
You may override static configuration on a per-request by attaching request parameters. For example, https://myapp.com/api/mydata?rmp_flamegraph=false
| Name | Description |
|---|---|
rmp_flamegraph | Overrides flamegraph_enabled If set to true will redirect to the flamegraph immediately. |
Profiling information is segregated by user ID. That means users cannot see each other's profiled requests. Per default, individual users are identified by their IP adress.
You may change this by setting a custom user provider:
config.user_provider = proc { |env| Rack::Request.new(env).ip }
You may also explicitly set the user by modifying your application controller (or the controller you have configured as UI base controller):
class ApplicationController < ActionController::Base
  before_action do
    RailsMiniProfiler::User.authorize(current_user.id)
  end
end
ApplicationController is used as the default base class for UI controllers. To change it, you may use configuration.ui.base_controller.
Rails Mini Profiler is not intended for performance reporting. There are other tools for that ( Skylight, New Relic, DataDog...). But you can still use RMP in production to profile specific requests.
Per default, no requests will be profiled in production, and the Rails Mini Profiler UI will be inaccessible.
Since profiling impacts performance, it is recommended that you limit which requests are being profiled:
RailsMiniProfiler.configure do |config|
  config.enabled = proc { |env| env.headers['RMP_ENABLED'].present? }
end
You must explicitly authorize profiling for users, as well as authenticate them to the UI:
class ApplicationController < ActionController::Base
  before_action do
    RailsMiniProfiler::User.authorize(current_user.id) # Requests by this user will now be profiled, and they get access to the UI
  end
end
Improving the performance of any application is a 3-step process. You have to answer these questions:
I'm a huge fan of rack-mini-profiler, and APM tools such as Skylight or Scout APM. Each of these tools has its own areas where it succeeds.
APM tools are excellent for profiling your app in production - aka. they show you what is slow - and offer some hints as to what causes the slowdown. rack-mini-profiler can do some sampling in production, but excels at providing detailed insight into why something is slow by providing Flamegraphs and detailed query information.
Rails Mini Profiler improves upon rack-mini-profiler in the latter regard. It is a developer tool, rather than a monitoring tool, and sets a big focus on developer experience. Simply put, it aims to be the best tool available to help you figure out why specific requests are slow.
As such, compared to rack-mini-profiler, it does not support non-Rails apps (e.g. Sinatra) or production sampling, but provides a much better user experience and better support for API-only applications.
Rails Mini Profiler is in early development. As such, breaking changes may still be introduced on a regular basis. While Rails Mini Profiler is in pre-release we do not offer upgrade migrations.
If an upgrade to Rails Mini Profiler breaks your application, we recommend that you clean house and start over. Re-run the initializer and overwrite existing files:
rails rails_mini_profiler:install
If only the DB schema is out of date, drop the offending tables and re-run migrations for the latest version:
rails rails_mini_profiler:install:migrations
rails db:migrate
Rails Mini Profiler supports API-only apps, but you have to make some small adjustments to use it. At the top of application.rb add Sprockets:
require "sprockets/railtie"
Then, modify application.rb:
module ApiOnly
  class Application < Rails::Application

    config.api_only = true # Either set this to false
    config.middleware.use ActionDispatch::Flash # Or add this
  end
end
Note: Sprockets and flash are currently required for some of Rails Mini Profiler's UI features. These modifications may no longer be needed in the future.
Make sure you have added StackProf to your Gemfile.
gem 'stackprof'
Flamegraphs are loaded into Speedscope using an Iframe and URI Encoded blobs (see source)
If your browser gives you warnings about blocking content due to CSP you must enable blob as default source:
Rails.application.config.content_security_policy do |policy|
    policy.default_src :self, :blob
    ...
end
StackProf, which is used for recording Flamegraphs, does not work on concurrent requests. Because of this, concurrent requests may skip recording a Flamegraph.
It is recommended that you resend only the request you wish to build a Flamegraph for.
This project was heavily inspired by projects such as rack-mini-profiler and rack-profiler. Skylight was also a huge influence.
Lena Schnedlitz designed the Logo and provided great support. Without her supreme CSS skills this project would not have been possible 🙌
See Contributing
This gem is available as open source under the terms of the MIT License.
FAQs
Unknown package
We found that rails_mini_profiler demonstrated a not healthy version release cadence and project activity because the last version was released a year ago. It has 1 open source maintainer collaborating on the project.
Did you know?

Socket for GitHub automatically highlights issues in each pull request and monitors the health of all your open source dependencies. Discover the contents of your packages and block harmful activity before you install or update your dependencies.

Security News
Malicious Nx npm versions stole secrets and wallet info using AI CLI tools; Socket’s AI scanner detected the supply chain attack and flagged the malware.

Security News
CISA’s 2025 draft SBOM guidance adds new fields like hashes, licenses, and tool metadata to make software inventories more actionable.

Security News
A clarification on our recent research investigating 60 malicious Ruby gems.