Product
Announcing Precomputed Reachability Analysis in Socket
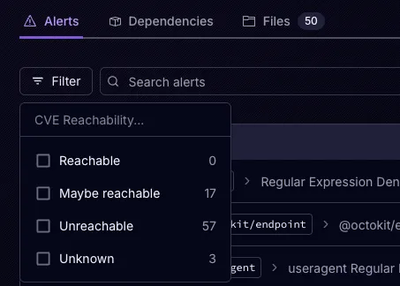
Socket’s precomputed reachability slashes false positives by flagging up to 80% of vulnerabilities as irrelevant, with no setup and instant results.
By Martin Torp - Jul 30, 2025
github.com/arl/statsviz

![]()
![]()
![]()
![]()
Visualize real time plots of your Go program runtime metrics, including heap, objects, goroutines, GC pauses, scheduler and more, in your browser.


Get the latest version:
go get github.com/arl/statsviz@latest
Register Statsviz HTTP handlers with your application http.ServeMux.
mux := http.NewServeMux()
statsviz.Register(mux)

go func() {
    log.Println(http.ListenAndServe("localhost:8080", mux))
}()
Open your browser at http://localhost:8080/debug/statsviz
If you check any of the boxes below:
/my/path/to/statsviz rather than /debug/statsvizhttps:// rather than http://Then you should use statsviz.NewServer to obtain a Server instance.
Both the Index() and Ws() methods return standard http.HandlerFunc.
srv, err := statsviz.NewServer(); // Create server or handle error
if err != nil { /* handle error */ }

// Do something with the handlers.
srv.Index()                       // UI (dashboard) http.HandlerFunc
srv.Ws()                          // Websocket http.HandlerFunc
Examples for the following cases, and more, are found in the _example directory:
http.DefaultServeMux or your own http.ServeMux/foo/bar instead of /debug/statsvizhttps:// rather than http://Statsviz is made of two parts:
The Ws serves a Websocket endpoint. When a client connects, your program's runtime/metrics are sent to the browser, once per second, via the websocket connection.
the Index http handler serves Statsviz user interface at /debug/statsviz at the address served by your program. When served, the UI connects to the Websocket endpoint and starts receiving data points.
Check out the API reference on pkg.go.dev.


Each plot belongs to one or more categories. The category selector allows you to filter the visible plots by categories.

Use the time range selector to define the visualized time span.

Show or hide the vertical lines representing garbage collection events.

Pause or resume the plot updates.

The visible set of plots depend on your Go version since some plots are only available in newer versions.


.png)


Since v0.6 you can add your own plots to Statsviz dashboard, in order to easily
visualize your application metrics next to runtime metrics.
Please see the userplots example.
Either use GitHub's discussions or come to say hi and ask a live question on #statsviz channel on Gopher's slack.
Please use issues for bugs and feature requests.
Pull-requests are always welcome!
More details in CONTRIBUTING.md.
See CHANGELOG.md.
See LICENSE
FAQs
Unknown package
Did you know?

Socket for GitHub automatically highlights issues in each pull request and monitors the health of all your open source dependencies. Discover the contents of your packages and block harmful activity before you install or update your dependencies.
Product
Socket’s precomputed reachability slashes false positives by flagging up to 80% of vulnerabilities as irrelevant, with no setup and instant results.
Product
Socket is launching experimental protection for Chrome extensions, scanning for malware and risky permissions to prevent silent supply chain attacks.

Product
Add secure dependency scanning to Claude Desktop with Socket MCP, a one-click extension that keeps your coding conversations safe from malicious packages.