Product
Socket Now Protects the Chrome Extension Ecosystem
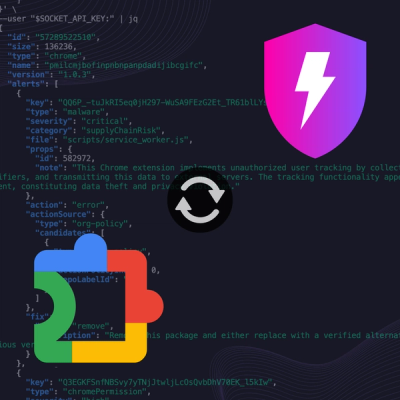
Socket is launching experimental protection for Chrome extensions, scanning for malware and risky permissions to prevent silent supply chain attacks.
github.com/open-telemetry/opentelemetry-collector-contrib/extension/pprofextension
| Status | |
|---|---|
| Stability | beta |
| Distributions | core, contrib, k8s |
| Issues |   |
| Code coverage | |
| Code Owners | @MovieStoreGuy |
Performance Profiler extension enables the golang net/http/pprof endpoint.
This is typically used by developers to collect performance profiles and
investigate issues with the service.
The following settings are required:
endpoint (default = localhost:1777): The endpoint in which the pprof will
be listening to. Use localhost: to make it available only locally, or
":" to make it available on all network interfaces.block_profile_fraction (default = 0): Fraction of blocking events that
are profiled. A value <= 0 disables profiling. See
https://golang.org/pkg/runtime/#SetBlockProfileRate for details.mutex_profile_fraction (default = 0): Fraction of mutex contention
events that are profiled. A value <= 0 disables profiling. See
https://golang.org/pkg/runtime/#SetMutexProfileFraction for details.The following settings can be optionally configured:
save_to_file: File name to save the CPU profile to. The profiling starts when the
Collector starts and is saved to the file when the Collector is terminated.Example:
extensions:
  pprof:
The full list of settings exposed for this exporter are documented in config.go with detailed sample configurations in testdata/config.yaml.
The profiler can be used to improve a program. The most common usage is a CPU profile, which determines where the program spends the most time while actively consuming resources. After generating a profile, we can interpret it in different ways. Go's pprof offers a text, visualization, or web-based analysis. To collect a meaningful profile, it should run on an idle machine and if that is not possible, it is best to generate the profile several times to get consistent results.
The profiler stops the program multiple times per second and collects information (such as program counters) at that point in time. This is called a sample, and a profile is a collection of those samples.
The extension enables the collection of profiling data expected by pprof.
To generate a profile, include the extension in your program and run it to start the server.
If you are using the default config, it will listen on localhost:1777.
To save a CPU profile on your machine, run go tool pprof http://localhost:1777/debug/pprof/profile\?seconds\=30.
This will enter the interactive mode of pprof, where you can analyze the profile.
There are different endpoints for other types of profiles.
For instance, the memory can be analyzed using go tool pprof http://localhost:1777/debug/pprof/heap.
To see all available profiles, visit http://localhost:1777/debug/pprof/ in your browser.
After running the above command to save the profile, pprof will enter the interactive mode. From here, the profiles can be analyzed.
Use the command web to open an image of the complete call graph in your browser.
Each box corresponds to a function in the program, and it is sized according to the number of samples in which this function was running.
This means, if the box of a function is bigger, it was executed more often than a function in a smaller box.
The arrows between boxes show the connectivity of the functions.
If there is an arrow from box A to B, A called B.
The numbers along the edges represent how often that call happened.
This includes every call of a recursive function.
The color of the edges also represents that number.
A red edge means more resources were used, whereas grey indicates the used resources were close to zero.
However, the complete call graph can be a bit noisy.
A good place to start breaking it down is using the topN command.
It will show you the top N nodes, consuming the most resources.
The output is a table, where the first two columns show the number and percentage of total samples where the function was running (flat).
The third column shows the total percentage, for instance stating that function X was running in 20% of the samples.
The two remaining columns show the cumulative (cum) numbers of the profile.
From here, the results can be filtered.
Choose one of the top consuming functions which you would like to analyze.
pprof uses a regex-based search to filter for functions matching the input.
Type web <function name> to show the call graph for this specific function.
The image in your browser should now be more clear and less cluttered.
The list command is also useful.
Type list <function name> to see the source code of your function, annotated with the resource consumption (flat and cum columns like in the topN command).
If you prefer to view it in your browser, use the weblist <function name> command instead.
In this view, you can see which line exactly used the most resources and start to improve it.
FAQs
Unknown package
Did you know?

Socket for GitHub automatically highlights issues in each pull request and monitors the health of all your open source dependencies. Discover the contents of your packages and block harmful activity before you install or update your dependencies.

Product
Socket is launching experimental protection for Chrome extensions, scanning for malware and risky permissions to prevent silent supply chain attacks.

Product
Add secure dependency scanning to Claude Desktop with Socket MCP, a one-click extension that keeps your coding conversations safe from malicious packages.

Product
Socket now supports Scala and Kotlin, bringing AI-powered threat detection to JVM projects with easy manifest generation and fast, accurate scans.