Product
Introducing Ruby Support in Socket
Socket is launching Ruby support for all users. Enhance your Rails projects with AI-powered security scans for vulnerabilities and supply chain threats. Now in Beta!
github.com/open-telemetry/opentelemetry-collector-contrib/receiver/hostmetricsreceiver
| Status | |
|---|---|
| Stability | development: logs |
| beta: metrics | |
| Distributions | core, contrib |
| Issues |   |
| Code Owners | @dmitryax, @braydonk |
The Host Metrics receiver generates metrics about the host system scraped from various sources and host entity event as log. This is intended to be used when the collector is deployed as an agent.
The collection interval, root path, and the categories of metrics to be scraped can be configured:
hostmetrics:
collection_interval: <duration> # default = 1m
initial_delay: <duration> # default = 1s
root_path: <string>
scrapers:
<scraper1>:
<scraper2>:
...
The available scrapers are:
| Scraper | Supported OSs | Description |
|---|---|---|
| cpu | All except Mac[1] | CPU utilization metrics |
| disk | All except Mac[1] | Disk I/O metrics |
| load | All | CPU load metrics |
| filesystem | All | File System utilization metrics |
| memory | All | Memory utilization metrics |
| network | All | Network interface I/O metrics & TCP connection metrics |
| paging | All | Paging/Swap space utilization and I/O metrics |
| processes | Linux, Mac | Process count metrics |
| process | Linux, Windows, Mac | Per process CPU, Memory, and Disk I/O metrics |
[1] Not supported on Mac when compiled without cgo which is the default.
Several scrapers support additional configuration:
disk:
  <include|exclude>:
    devices: [ <device name>, ... ]
    match_type: <strict|regexp>
filesystem:
  <include_devices|exclude_devices>:
    devices: [ <device name>, ... ]
    match_type: <strict|regexp>
  <include_fs_types|exclude_fs_types>:
    fs_types: [ <filesystem type>, ... ]
    match_type: <strict|regexp>
  <include_mount_points|exclude_mount_points>:
    mount_points: [ <mount point>, ... ]
    match_type: <strict|regexp>
cpu_average specifies whether to divide the average load by the reported number of logical CPUs (default: false).
load:
  cpu_average: <false|true>
network:
  <include|exclude>:
    interfaces: [ <interface name>, ... ]
    match_type: <strict|regexp>
process:
  <include|exclude>:
    names: [ <process name>, ... ]
    match_type: <strict|regexp>
  mute_process_all_errors: <true|false>
  mute_process_name_error: <true|false>
  mute_process_exe_error: <true|false>
  mute_process_io_error: <true|false>
  mute_process_user_error: <true|false>
  mute_process_cgroup_error: <true|false>
  scrape_process_delay: <time>
The following settings are optional:
mute_process_all_errors (default: false): mute all the errors encountered when trying to read metrics of a process. When this flag is enabled, there is no need to activate any other error suppression flags.mute_process_name_error (default: false): mute the error encountered when trying to read a process name the collector does not have permission to read. This flag is ignored when mute_process_all_errors is set to true as all errors are muted.mute_process_io_error (default: false): mute the error encountered when trying to read IO metrics of a process the collector does not have permission to read. This flag is ignored when mute_process_all_errors is set to true as all errors are muted.mute_process_cgroup_error (default: false): mute the error encountered when trying to read the cgroup of a process the collector does not have permission to read. This flag is ignored when mute_process_all_errors is set to true as all errors are muted.mute_process_exe_error (default: false): mute the error encountered when trying to read the executable path of a process the collector does not have permission to read (Linux only). This flag is ignored when mute_process_all_errors is set to true as all errors are muted.mute_process_user_error (default: false): mute the error encountered when trying to read a uid which doesn't exist on the system, eg. is owned by a user that only exists in a container. This flag is ignored when mute_process_all_errors is set to true as all errors are muted.If you are only interested in a subset of metrics from a particular source, it is recommended you use this receiver with the Filter Processor.
If you would like to scrape some metrics at a different frequency than others,
you can configure multiple hostmetrics receivers with different
collection_interval values. For example:
receivers:
  hostmetrics:
    collection_interval: 30s
    scrapers:
      cpu:
      memory:

  hostmetrics/disk:
    collection_interval: 1m
    scrapers:
      disk:
      filesystem:

service:
  pipelines:
    metrics:
      receivers: [hostmetrics, hostmetrics/disk]
Host metrics are collected from the Linux system directories on the filesystem. You likely want to collect metrics about the host system and not the container. This is achievable by following these steps:
The simplest configuration is to mount the entire host filesystem when running
the container. e.g. docker run -v /:/hostfs ....
You can also choose which parts of the host filesystem to mount, if you know
exactly what you'll need. e.g. docker run -v /proc:/hostfs/proc.
root_pathConfigure root_path so the hostmetrics receiver knows where the root filesystem is.
Note: if running multiple instances of the host metrics receiver, they must all have
the same root_path.
Example:
receivers:
  hostmetrics:
    root_path: /hostfs
Currently, the hostmetrics receiver does not set any Resource attributes on the exported metrics. However, if you want to set Resource attributes, you can provide them via environment variables via the resourcedetection processor. For example, you can add the following resource attributes to adhere to Resource Semantic Conventions:
export OTEL_RESOURCE_ATTRIBUTES="service.name=<the name of your service>,service.namespace=<the namespace of your service>,service.instance.id=<uuid of the instance>"
Entity Events as logs are experimental and might eventually be replaced by the result of the OTEP. For now, the hostmetrics receiver can send the host entity event as a log records. By default, the hostmetrics receiver sends periodic EntityState events every 5 minutes. You can change that by setting metadata_collection_interval. Entity Events as logs are experimental. The result of the OTEP might eventually replace that.
FAQs
Unknown package
Did you know?

Socket for GitHub automatically highlights issues in each pull request and monitors the health of all your open source dependencies. Discover the contents of your packages and block harmful activity before you install or update your dependencies.

Product
Socket is launching Ruby support for all users. Enhance your Rails projects with AI-powered security scans for vulnerabilities and supply chain threats. Now in Beta!

Product
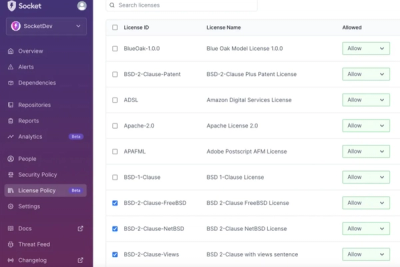
Ensure open-source compliance with Socket’s License Enforcement Beta. Set up your License Policy and secure your software!

Product
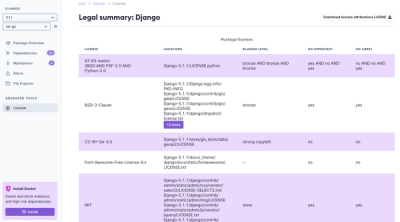
We're launching a new set of license analysis and compliance features for analyzing, managing, and complying with licenses across a range of supported languages and ecosystems.