Product
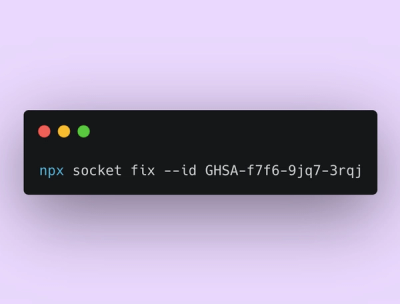
Announcing Socket Fix 2.0
Socket Fix 2.0 brings targeted CVE remediation, smarter upgrade planning, and broader ecosystem support to help developers get to zero alerts.
github.com/storybookjs/storybook-addon-console
There're some cases when you can't / don't want / forgot to keep browser console opened. This addon helps you to get all console output in your storybook. In other cases, you might find it difficult to extract the desired information in the information noise issued by the console or to determine which component in what state gives the message. With this addon, you can control what you see and where you see.
We assume the following possible applications:
Mobile devices. You might want to make console output reachable for users when they need to work with your storybook from mobile browsers
Small screens. You can save your screen space keeping browser console closed
To filter your console output. You can independently configure both action logger and real console output in a wide range.
To associate console messages with a specific components/stories. You can see which story emits which message
To output some data into Action Logger from your deep components without importing addon-actions for that.
try live demo
npm i @storybook/addon-console @storybook/addon-actions --save-dev
Just import it in your storybook config.js:
// config.js

import '@storybook/addon-console';
That's all. You'll start to receive all console messages, warnings, errors in your action logger panel. Everything except HMR logs.
If you want to enable HMR messages, do the following:
// config.js

import { setConsoleOptions } from '@storybook/addon-console';

setConsoleOptions({
panelExclude: [],
});
You'll receive console outputs as a console, warn and error actions in the panel. You might want to know from what
stories they come. In this case, add withConsole decorator:
// config.js

import { addDecorator } from '@storybook/react';
import { withConsole } from '@storybook/addon-console';

addDecorator((storyFn, context) => withConsole()(storyFn)(context));
After that your messages in Action Logger will be prefixed with the story path, like molecules/atoms/electron: ["ComponentDidMount"] or molecules/atoms/electron error: ["Warning: Failed prop type..."]. You can setup addon
behavior by passing options to withConsole or setConsoleOptions methods, both have the same API.
Addon console don't have own UI panel to output logs, it use addon-console instead. Make sure that addons.js contains this line:
// addons.js

import '@storybook/addon-actions/register';
It handles console.log, console.warn, and console.error methods and not catched errors. By default, it just reflects all console messages in the Action Logger Panel (should be installed as a peerDependency) except [HMR] logs.
addonOptionsfunctionObjectaddonOptionsaddonOptionsSet addon options and returns a new one
Kind: static method of @storybook/addon-console
See
| Param | Type |
|---|---|
| optionsOrFn | addonOptions | optionsCallback |
Example
import { setConsoleOptions } from '@storybook/addon-console';

const panelExclude = setConsoleOptions({}).panelExclude;
setConsoleOptions({
  panelExclude: [...panelExclude, /deprecated/],
});
functionWraps your stories with specified addon options.
If you don't pass {log, warn, error} in options argument it'll create them from context for each story individually. Hence you'll see from what exact story you got a log or error. You can log from component's lifecycle methods or within your story.
Kind: static method of @storybook/addon-console
Returns: function - wrappedStoryFn
See
| Param | Type |
|---|---|
| [optionsOrFn] | addonOptions | optionsCallback |
Example
import { storiesOf } from '@storybook/react';
import { withConsole } from '@storybook/addon-console';

storiesOf('withConsole', module)
 .addDecorator((storyFn, context) => withConsole()(storyFn)(context))
 .add('with Log', () => <Button onClick={() => console.log('Data:', 1, 3, 4)}>Log Button</Button>)
 .add('with Warning', () => <Button onClick={() => console.warn('Data:', 1, 3, 4)}>Warn Button</Button>)
 .add('with Error', () => <Button onClick={() => console.error('Test Error')}>Error Button</Button>)
 .add('with Uncatched Error', () =>
   <Button onClick={() => console.log('Data:', T.buu.foo)}>Throw Button</Button>
 )
 // Action Logger Panel:
 // withConsole/with Log: ["Data:", 1, 3, 4]
 // withConsole/with Warning warn: ["Data:", 1, 3, 4]
 // withConsole/with Error error: ["Test Error"]
 // withConsole/with Uncatched Error error: ["Uncaught TypeError: Cannot read property 'foo' of undefined", "http://localhost:9009/static/preview.bundle.js", 51180, 42, Object]
ObjectThis options could be passed to withConsole or setConsoleOptions
Kind: inner typedef of @storybook/addon-console
Properties
| Name | Type | Default | Description |
|---|---|---|---|
| [panelExclude] | [ 'Array' ].<RegExp> | [/[HMR]/] | Optional. Anything matched to at least one of regular expressions will be excluded from output to Action Logger Panel |
| [panelInclude] | [ 'Array' ].<RegExp> | [] | Optional. If set, only matched outputs will be shown in Action Logger. Higher priority than panelExclude. |
| [consoleExclude] | [ 'Array' ].<RegExp> | [] | Optional. Anything matched to at least one of regular expressions will be excluded from DevTool console output |
| [consoleInclude] | [ 'Array' ].<RegExp> | [] | Optional. If set, only matched outputs will be shown in console. Higher priority than consoleExclude. |
| [log] | string | "console" | Optional. The marker to display console.log outputs in Action Logger |
| [warn] | string | "warn" | Optional. The marker to display warnings in Action Logger |
| [error] | string | "error" | Optional. The marker to display errors in Action Logger |
addonOptionsThis callback could be passed to setConsoleOptions or withConsole
Kind: inner typedef of @storybook/addon-console
Returns: addonOptions - - new addonOptions
| Param | Type | Description |
|---|---|---|
| currentOptions | addonOptions | the current addonOptions |
Example
import { withConsole } from `@storybook/addon-console`;

const optionsCallback = (options) => ({panelExclude: [...options.panelExclude, /Warning/]});
addDecorator((storyFn, context) => withConsole(optionsCallback)(storyFn)(context));
npm start runs example Storybook. Then you can edit source code located in the src folder and example storybook in
the stories folder.
Run npm run test. It starts jest test in watch mode.
After running tests you can explore coverage details in .coverage/lcov-report/index.html
If you're using VSCode you can debug tests and source by launching Jest Tests task from Debug Menu. It allows to set
breakpoints in *.test.js and *.js files.
Please, don't edit this README.md directly. Run npm run dev:docs and change docs/readme.hbs and JSDoc comments
withing src instead.
FAQs
Unknown package
Did you know?

Socket for GitHub automatically highlights issues in each pull request and monitors the health of all your open source dependencies. Discover the contents of your packages and block harmful activity before you install or update your dependencies.

Product
Socket Fix 2.0 brings targeted CVE remediation, smarter upgrade planning, and broader ecosystem support to help developers get to zero alerts.

Security News
Socket CEO Feross Aboukhadijeh joins Risky Business Weekly to unpack recent npm phishing attacks, their limited impact, and the risks if attackers get smarter.

Product
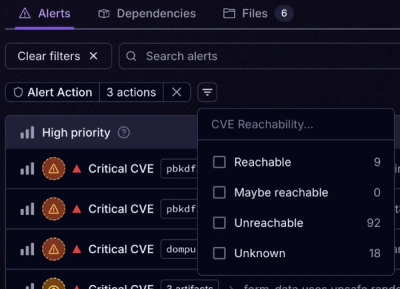
Socket’s new Tier 1 Reachability filters out up to 80% of irrelevant CVEs, so security teams can focus on the vulnerabilities that matter.