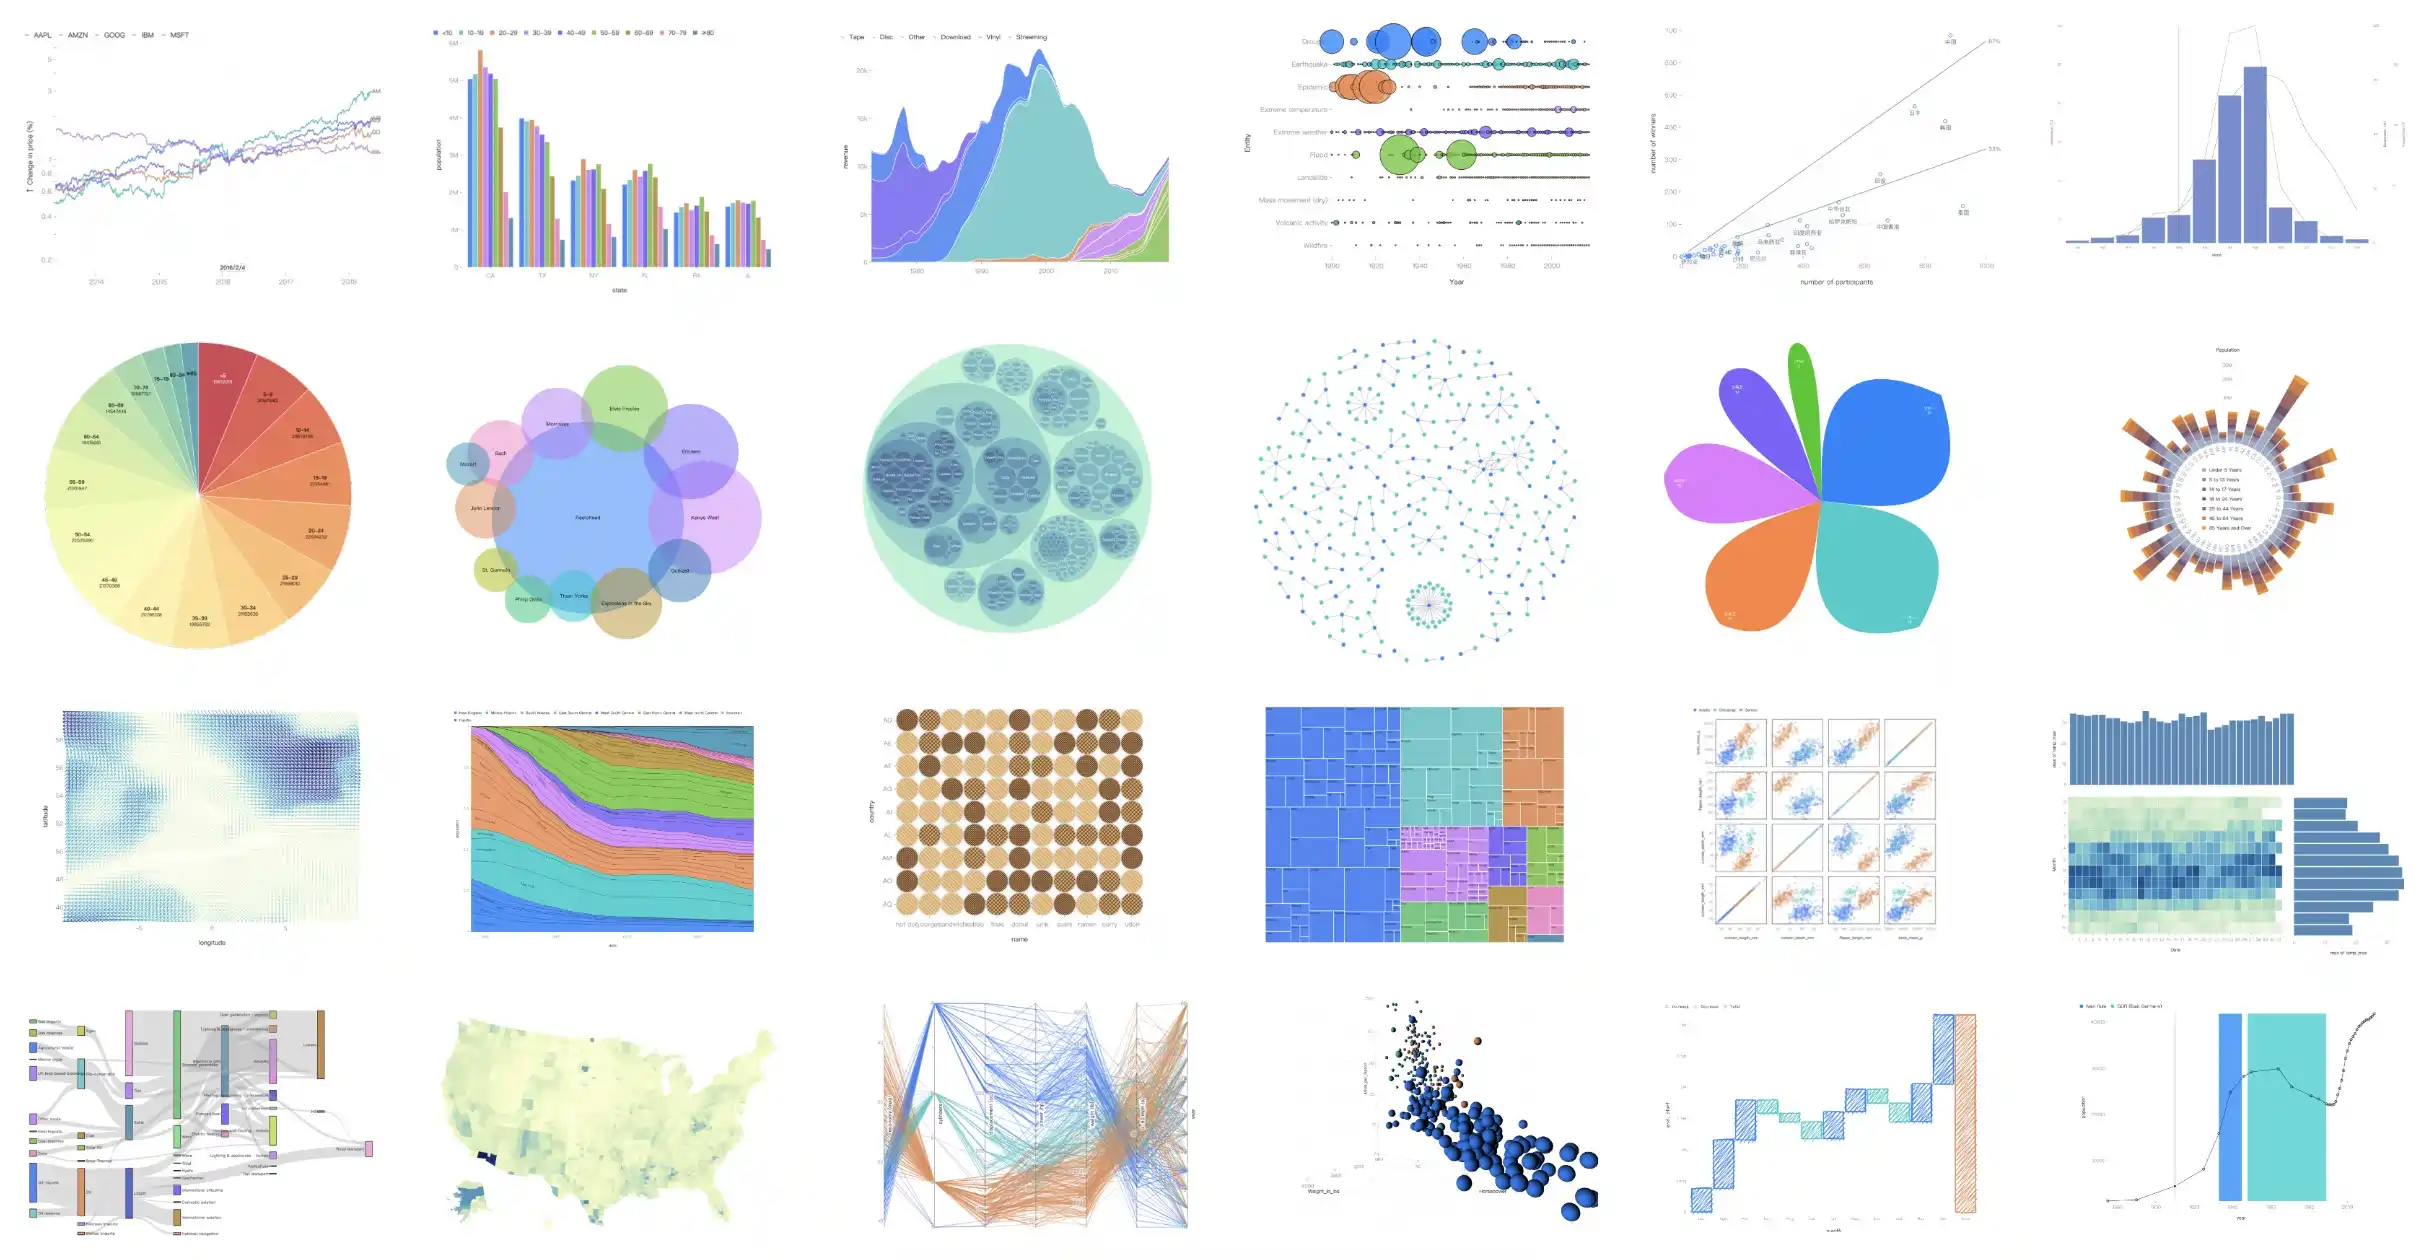
What is @antv/g2?
@antv/g2 is a powerful and flexible data visualization library for creating a wide range of charts and graphs. It is designed to be highly customizable and supports a variety of chart types, including bar charts, line charts, pie charts, and more. The library is built on top of the AntV visualization ecosystem and provides a declarative syntax for defining visualizations.
What are @antv/g2's main functionalities?
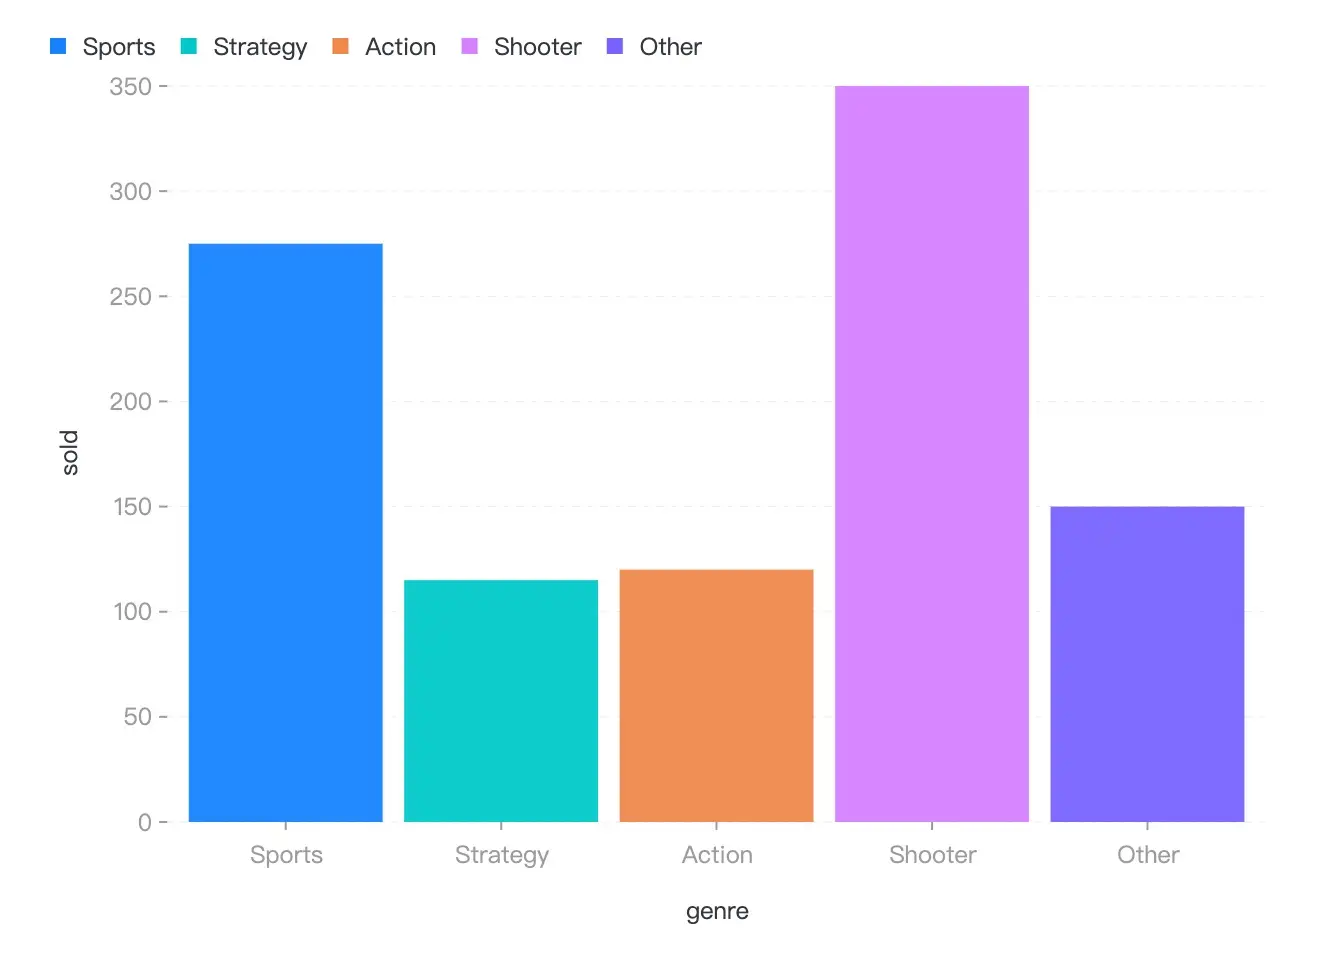
Bar Chart
This code creates a simple bar chart using the @antv/g2 library. It defines a dataset and uses the `interval` geometry to create bars representing the data.
const { Chart } = require('@antv/g2');
const data = [
{ genre: 'Sports', sold: 275 },
{ genre: 'Strategy', sold: 115 },
{ genre: 'Action', sold: 120 },
{ genre: 'Shooter', sold: 350 },
{ genre: 'Other', sold: 150 }
];
const chart = new Chart({ container: 'container', autoFit: true, height: 500 });
chart.data(data);
chart.interval().position('genre*sold');
chart.render();
Line Chart
This code creates a line chart using the @antv/g2 library. It defines a dataset and uses the `line` geometry to create a line representing the data over time.
const { Chart } = require('@antv/g2');
const data = [
  { year: '1991', value: 3 },
  { year: '1992', value: 4 },
  { year: '1993', value: 3.5 },
  { year: '1994', value: 5 },
  { year: '1995', value: 4.9 },
  { year: '1996', value: 6 },
  { year: '1997', value: 7 },
  { year: '1998', value: 9 },
  { year: '1999', value: 13 }
];
const chart = new Chart({ container: 'container', autoFit: true, height: 500 });
chart.data(data);
chart.scale({ year: { range: [0, 1] }, value: { min: 0 } });
chart.line().position('year*value');
chart.render();
Pie Chart
This code creates a pie chart using the @antv/g2 library. It defines a dataset and uses the `interval` geometry with a `theta` coordinate to create slices representing the data.
const { Chart } = require('@antv/g2');
const data = [
  { item: 'A', count: 40 },
  { item: 'B', count: 21 },
  { item: 'C', count: 17 },
  { item: 'D', count: 13 },
  { item: 'E', count: 9 }
];
const chart = new Chart({ container: 'container', autoFit: true, height: 500 });
chart.data(data);
chart.coordinate('theta', { radius: 0.75 });
chart.interval().position('count').color('item').adjust('stack');
chart.render();
Other packages similar to @antv/g2
chart.js
Chart.js is a popular open-source library for creating simple yet flexible charts. It supports a variety of chart types, including bar, line, and pie charts. Compared to @antv/g2, Chart.js is easier to get started with but may lack some of the advanced customization options.
d3
D3.js is a powerful library for creating complex and highly customizable data visualizations. It provides low-level building blocks for creating a wide range of visualizations. Compared to @antv/g2, D3.js offers more control and flexibility but has a steeper learning curve.
highcharts
Highcharts is a commercial charting library that offers a wide range of chart types and extensive customization options. It is known for its high-quality visualizations and ease of use. Compared to @antv/g2, Highcharts provides more out-of-the-box features but requires a license for commercial use.

 English |