Product
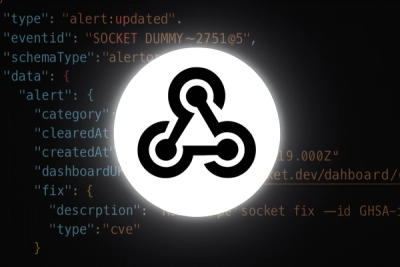
Introducing Webhook Events for Alert Changes
Add real-time Socket webhook events to your workflows to automatically receive software supply chain alert changes in real time.
By Phil Gates-Idem - Nov 21, 2025
@aspecto/opentelemetry
Advanced tools
Aspecto is an observability platform, powered by OpenTelemetry, that brings R&D teams complete visibility into every interaction, performance issue, and error happening within their distributed services.
npm install @aspecto/opentelemetry
Supported node version: >= 14
In the root folder create an aspecto.json file with the content {"aspectoAuth" : "-- token goes here --"}.
You can get your token from here
Add this call at the top of your app entry point:
require('@aspecto/opentelemetry')();

// the rest of your main file requires
See below for more configuration options
You can configure the package via one or more of the following:
options variable. for example: require('@aspecto/opentelemetry')({optionName: optionValue});aspecto.json configuration file to the root directory, next to service's package.json fileValues are evaluated in the following priority:
options object| Option Name | Environment Variable | Type | Default | Description |
|---|---|---|---|---|
disableAspecto | DISABLE_ASPECTO | boolean | false | Disable aspecto |
env | NODE_ENV | string | - | Set environment name manually |
aspectoAuth | ASPECTO_AUTH | UUID | - | Set Aspecto token from code instead of using aspecto.json |
serviceName | OTEL_SERVICE_NAME | string | name key in package.json | Set serviceName manually instead of reading it from package.json. For example: a service that runs in multiple "modes" |
serviceVersion | OTEL_SERVICE_VERSION | string | version key in package.json | Set serviceVersion manually instead of reading it from package.json |
samplingRatio | ASPECTO_SAMPLING_RATIO | number | 1.0 | How many of the traces starting in this service should be sampled. Set to number in range [0.0, 1.0] where 0.0 is no sampling, and 1.0 is sample all. Specific rules set via aspecto app takes precedence |
requireConfigForTraces | ASPECTO_REQUIRE_CONFIG_FOR_TRACES | boolean | false | When true, the SDK will not trace anything until remote sampling configuration arrives (few hundreds ms). Can be used to enforce sampling configuration is always applied, with the cost of losing traces generated during service startup. |
logger | - | logger interface | - | Logger to be used in this tracing library. Common use for debugging logger: console |
collectPayloads | ASPECTO_COLLECT_PAYLOADS | boolean | true | Should Aspecto SDK collect payloads of operations |
otlpCollectorEndpoint | OTEL_EXPORTER_OTLP_TRACES_ENDPOINT | string | https://otelcol-fast.aspecto.io/v1/trace | Target URL to which the OTLP http exporter is going to send spans |
exportBatchSize | ASPECTO_EXPORT_BATCH_SIZE | number | 100 | How many spans to batch in a single export to the collector |
exportBatchTimeoutMs | ASPECTO_EXPORT_BATCH_TIMEOUT_MS | number | 1000 (1s) | Maximum time in ms for batching spans before sending to collector |
writeSystemLogs | - | boolean | false | If true, emit all log messages from Opentelemetry SDK to supplied logger if present, or to console if missing |
customZipkinEndpoint | - | URL | Send all traces to additional Zipkin server for debug | |
sqsExtractContextPropagationFromPayload | ASPECTO_SQS_EXTRACT_CONTEXT_PROPAGATION_FROM_PAYLOAD | boolean | true | For aws-sdk instrumentation. Should be true when the service receiveMessages from SQS which is subscribed to SNS and subscription configured with "Raw message delivery": Disabled. Setting to false is a bit more performant as it turns off JSON parse on message payload |
extractB3Context | ASPECTO_EXTRACT_B3_CONTEXT | boolean | false | Set to true when the service receives requests from another instrumented component that propagate context via B3 protocol multi or single header. For example: Envoy Proxy, Ambassador and Istio |
injectB3ContextSingleHeader | ASPECTO_INJECT_B3_CONTEXT_SINGLE_HEADER | boolean | false | Set to true when the service send traffic to another instrumented component that propagate context via B3 single header protocol |
injectB3ContextMultiHeader | ASPECTO_INJECT_B3_CONTEXT_MULTI_HEADER | boolean | false | Set to true when the service send traffic to another instrumented component that propagate context via B3 multi header protocol. For example: Envoy Proxy, Istio |
"Span" is the name of the data structure representing an interesting operation in your app.
Aspecto will automatically collect spans for operations created by popular packages that perform IO (such as http, messaging systems, databases, etc).
Manual spans are used if you need to trace an operation in a code you wrote, or when using a package that does not provide an automatic tracing.
To create a Manual Span for a function run, you need to wrap it in a trace call like this:
import { trace } from '@aspecto/opentelemetry'; // ES import
const { trace } = require('@aspecto/opentelemetry'); // CommonJS require

trace(
    // All options are optional
    {
        name: '** optional name for the operation **',
        metadata: {
            'metadata.key.for.the.operation': 'you can attach custom metadata to the operation',
        },
        type: 'Type of Operation',
    },
    () => {
        // your code which you want to trace
    }
);
You can add attributes to your spans for more visibility.
Attributes can be added to a span at any time before the span is finished:
import { setAttribute, setAttributes } from '@aspecto/opentelemetry';

// add a single attribute
const result = setAttribute('foo', 'bar');

// add multiple attributes
const result = setAttributes({ foo: 'bar' });

// result will be true in case of success
(*) All keys will get a prefix of 'aspecto.extra'.
A common use case for the Trace Search tool is to see the related trace while inspecting a log event.
To do this, you must attach an active traceId to your logs.
Use the getContext method, exposed from our package, to attach traceId to your logs:
const { getContext } = require('@aspecto/opentelemetry');

console.log('Something happened!', { traceId: getContext().traceId })});
Live Stream Traces captures all payloads and traces for a specific host/instance. You can access it by clicking the link from the service output:
=====================================================================================================================================
| |
| 🕵️♀️ See the live stream tracing at https://app.aspecto.io/app/live-stream-traces/sessions?instanceId=14243e72-14dc-4255-87af-ef846b247578 |
| |
=====================================================================================================================================
You only need to click the link once to see traces from all the microservices, that are running on your environment. Also this link is valid for a limited period of time (couple of days, but it may change in the future). If you don't see trace from some microservice (or none of them), please click the newly-generated link.
Aspecto supports instrumenting AWS lambdas.
To do so, set up Aspecto as you'd usually do, and extract the returned lambda utility:
const { lambda } = require('@aspecto/opentelemetry')();
Next, wrap your function handler definition with the returned utility.
Example:
// Before
module.exports.myCallbackHandler = (event, context, callback) => { ... };
module.exports.myAsyncHandler = async (event, context) => { ... };

// After
module.exports.myCallbackHandler = lambda((event, context, callback) => { ... });
module.exports.myAsyncHandler = lambda(async (event, context) => { ... });
Notice: if your lambda is not deployed with a package.json file, make sure to provide the serviceName option when initializing Aspecto.
Aspecto supports instrumenting GCF with http trigger.
To do so, set up Aspecto as you'd usually do, and extract the gcf utility:
const { gcf } = require('@aspecto/opentelemetry')();
Next, wrap your function handler definition with the returned utility. Example:
// Before
exports.myEndpoint = (req, res) => { ... };

// After
exports.myEndpoint = gcf((req, res) => { ... });
To instrument your test with aspecto using mocha version 8.0.0 and above, register mocha plugin as instructed below.
In this mode, token (and other configuration) can be set only via aspecto.json config file or environment variables.
mocha --require @aspecto/opentelemetry/mocha
  "mocha": {
    "require": [
      "@aspecto/opentelemetry/mocha"
    ]
  }
{
    "require": [
        "@aspecto/opentelemetry/mocha"
    ]
}
FAQs
Aspecto auto instrumentation for nodejs applications
We found that @aspecto/opentelemetry demonstrated a not healthy version release cadence and project activity because the last version was released a year ago. It has 5 open source maintainers collaborating on the project.
Did you know?

Socket for GitHub automatically highlights issues in each pull request and monitors the health of all your open source dependencies. Discover the contents of your packages and block harmful activity before you install or update your dependencies.
Product
Add real-time Socket webhook events to your workflows to automatically receive software supply chain alert changes in real time.
Product
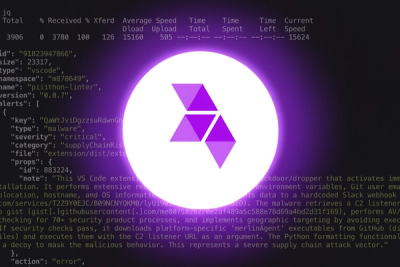
Socket now scans OpenVSX extensions, giving teams early detection of risky behaviors, hidden capabilities, and supply chain threats in developer tools.
Product
Bringing supply chain security to the next generation of JavaScript package managers