🎩 You're Invited:Meet the Socket team at Black Hat in Las Vegas, August 3-6.RSVP →
@bobsworkshop/cli
Advanced tools

@bobsworkshop/cli - npm Package Compare versions
+1
-1
| { | ||
| "name": "@bobsworkshop/cli", | ||
| "version": "1.3.0", | ||
| "version": "1.4.0", | ||
| "description": "Bob's CLI — AI coding assistant and Forge orchestrator", | ||
@@ -5,0 +5,0 @@ "type": "module", |
+54
-0
@@ -148,3 +148,39 @@ | ||
| --- | ||
| ## Profile Trends — Visualize How You Evolve | ||
| Bob tracks your psychological state, behavioral patterns, and mood across every session — and now renders that history as a color-coded sparkline chart directly in your terminal. | ||
| ```bash | ||
| bob profile --trends # Last 7 days | ||
| bob profile --trends --trends-days 14 # Last 14 days | ||
| bob profile --trends --trends-days 30 # Last 30 days | ||
| ``` | ||
| Each metric is rendered as a sparkline where every bar character is individually colored based on its own score value: | ||
| 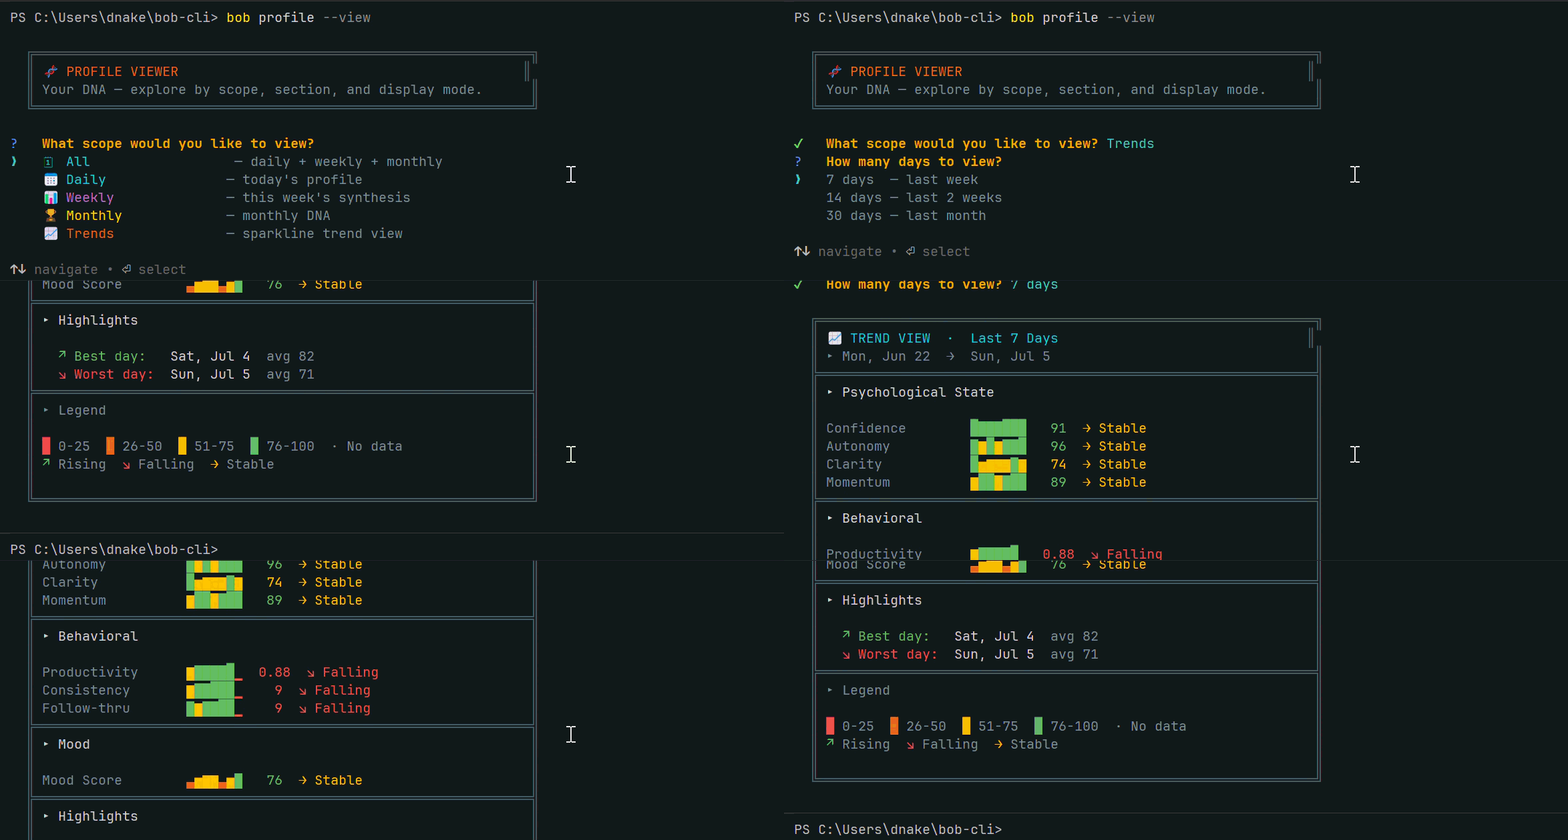 | ||
| **Color coding:** | ||
| - 🔴 Red `0-25` — Critical attention needed | ||
| - 🟠 Orange `26-50` — Below baseline | ||
| - 🟡 Yellow `51-75` — Functional range | ||
| - 🟢 Green `76-100` — Peak performance | ||
| **Trend arrows:** | ||
| - `↗` Green — Rising trajectory | ||
| - `↘` Red — Falling trajectory | ||
| - `→` Yellow — Holding stable | ||
| Every individual bar character in the sparkline is colored based on its own score — so a single row can visually show a red-to-green arc as your metric improved across the days. Best and worst day highlights give you instant pattern recognition across the full window. | ||
| Data is pulled from your cloud profile history (authenticated users) or local daily profile files (Tier 1). Supports any number of days from 1 to 90. | ||
| ```bash | ||
| bob profile --view # Interactive profile viewer | ||
| bob profile --view --full # Full text, no truncation | ||
| bob profile --view --scope daily # Daily profile only | ||
| bob profile --view --scope monthly # Monthly DNA only | ||
| bob profile --view --scope daily --section mood # Specific section | ||
| ``` | ||
| ## The Crew — Your Autonomous Engineering Department | ||
@@ -625,2 +661,20 @@ | ||
| --- | ||
| ## What's New in v1.4.0 | ||
| - **Interactive Profile Viewer** — `bob profile --view` now launches a fully interactive selector where you choose scope (daily, weekly, monthly, or all), section (decision, emotions, mood, behavioral, strategic, DNA, predictions, summary), and display mode (summary or full). Navigate your entire behavioral profile without memorizing flags. | ||
| - **Full Mode** — `bob profile --view --full` removes all text truncation. Every assessment, every quote, every insight rendered in complete form. No more `...` cutting off the detail that matters. | ||
| - **Sparkline Trend Chart** — `bob profile --trends` renders a color-coded historical trend view of your psychological state, behavioral metrics, and mood score across the last 7, 14, or 30 days. Each bar character is individually colored — red (0-25), orange (26-50), yellow (51-75), green (76-100) — with colored trend arrows showing rising, falling, or stable trajectories. | ||
| - **`getCLIProfileHistory` cloud function** — New backend function that fetches the last N daily profile snapshots from Firestore for trend rendering. Supports 1-90 day range with aligned decision, behavioral, mood, and emotion data per day. Tier 1 users fall back to locally stored daily profiles automatically. | ||
| - **Direct scope/section flags** — Skip the interactive selector entirely with `bob profile --view --scope daily --section mood` or `bob profile --view --scope monthly --section dna`. Combine with `--full` for expanded output. | ||
| - **Profile command reference updated** — New flags: `--full`, `--scope <scope>`, `--section <section>`, `--trends`, `--trends-days <number>`. | ||
| ## What's New in v1.3.0 | ||
| - **Full terminal UI design system** — Every CLI surface now operates from a single locked design token system: brand colors, mode colors (chat, deep dive, consultant, personalization), semantic status colors, spacing rules, separator hierarchy, and icon vocabulary. The product now looks and feels like one cohesive tool rather than a collection of screens. | ||
| - **Command Center polish** — `bob cc` and `bob command-center` now render a full `╔══╗` header card with conversation ID, color-coded stats bar, fixed-width task board columns (status · category · description), styled execution stream with stage-prefixed log lines, and completion summary cards. | ||
| - **Analysis results polish** — `bob analyse --bugs/--features/--improvements/--upgrades` now renders a category header card, fixed-width choice columns, properly padded expanded view with `▸` field prefixes, styled empty state, and implementation feedback cards for every outcome. | ||
| - **Autonomy UI polish** — `bob autonomy` header, queue, and report cards fully redesigned with the design token system. Semantic token names throughout. All raw chalk colors replaced. | ||
| - **`bob cc` alias active** — Command Center is now registered in `bin/bob.ts`. Both `bob command-center` and `bob cc` work. | ||
| - **Bug fix: readline double-input (`yy`) on Windows + Node v24** — File approval prompts no longer capture duplicate keystrokes on Windows PowerShell with Node 24.14.1. Root cause was competing readline instances on the same stdin stream. Fixed by creating a temporary isolated readline interface for the approval prompt. | ||
| - | ||
| ## What's New in v1.2.0 | ||
@@ -627,0 +681,0 @@ |
Sorry, the diff of this file is too big to display
New alerts
Filesystem access
Supply chain riskAccesses the file system, and could potentially read sensitive data.
AI-detected potential code anomaly
Supply chain riskAI has identified unusual behaviors that may pose a security risk.
Fixed alerts
AI-detected potential code anomaly
Supply chain riskAI has identified unusual behaviors that may pose a security risk.
Improved metrics
- Total package byte prevSize
2321433
2.03%- Lines of code
49679
2.31%- Number of lines in readme file
753
7.73%Worsened metrics
- Number of low supply chain risk alerts
269
1.13%No dependency changes