LightningChart® JS - World's Fastest JavaScript Charts
LightningChart JS is a WebGL based, lightning-fast real-time data visualization charting library with a focus on exceptional performance. Performance testing results prove it’s able to visualize streaming data rates no other library for JS can, both in 2D and 3D. The fastest rendering real JavaScript charting library.
LightningChartJS was republished under different NPM organization in 2024. Legacy package can be found here
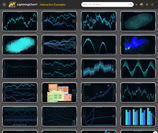
Interactive examples, with code editing on-the-fly
Whether you are first learning about LightningChart, investigating if it suits your needs or starting with your own application development our interactive examples application is the place to start from.
Click here to browse almost all LightningChart JS features, interact with the charts, test the performance and see how the code looks.
More interactive examples
Useful links
Performance comparison:
We have made multiple comparisons of LightningChart® JS against other popular JavaScript charting libraries.
Check all of the comparisons and find out how we got the results here
Some performance results, with a typical desktop PC:
- Static line series: 10 million data points in 290 ms. Up to several billion samples.
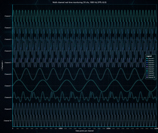
- Scrolling line series: 400 channels simultaneously with 1 000 Hz data stream rate per channel and 1 minute time window, adding up to a grand total of 24 million data points visible at every frame and updated at 60 FPS
- Heat maps: 30000x30000 heat map can be loaded in less than 5 seconds
- Scatter series: load massive raw data sets up to 500 million samples (and more depending on hardware)
Key features:
- GPU acceleration and WebGL rendering
- Intuitive touch screen interactivity with zooming, panning, moving data cursors etc.
- Dashboard control, capable of rendering 100+ charts.
- Supports server side rendering (use with our @lightningchart/lcjs-headless package)
- Chart types: 3D, XY, Heatmaps, Polar, Radar, Spider, Pie, Donut, Funnel, Bar, Stacked Bar, Grouped Bar, Gauge, Pyramid and Treemap charts
- Linear and Logarithmic Axis for XY Charts
- Data Grid for displaying data in form of real-time tables with icons, text, numbers, coloring and miniature charts
- Extremely customizable, flexible and adaptable to different user interface and design requirements
Installation
For latest instructions, please refer to Developer Documentation.
1. Install from NPM and use a bundler
Install the library package from NPM.
npm install --save @lightningchart/lcjs
This package can be used with any bundler that supports CommonJS. Some examples of bundlers that work are WebPack, Parcel and Rollup.
Check our getting started video on LightningChart JS to see this in action.
Any of our Examples can be used as a seed project. All examples on that page have been made to standalone repositories which can be found on our GitHub. Standalone Example Repositories
2. Use IIFE bundle directly on a webpage
The library is distributed with a browser ready IIFE bundle. This bundle can be used directly in browsers with script tag. You can see an example implementation of this method in our Developer Documentation
All of our examples can be used in the html page. To use them,
first find an example you want to use from interactive examples.
Click Edit this example. On the bottom of the page click on the button that reads CJS. That will switch our code to be IIFE compatible.
After that, the code can be copied to the html page. See our LightningChart JS html usage example for more detailed information.
Licensing
LightningChart JS requires a license key to be used.
Get one here.
const lc = lightningChart({ license: 'my-license-key' })
const chart = lc.ChartXY()
For latest instructions, please refer to Developer Documentation.
Terms of use can be found here.
For more materials, instructions, guides and troubleshooting, please refer to the more conclusive Developer Documentation.