
Security News
Federal Audit Finds NIST Wasted Funds With No Plan to Clear NVD Backlog
Federal audit finds NIST lacked a plan to clear the NVD backlog, wasted funds on duplicate work, and delayed use of CISA data.
By Sarah Gooding - Jun 03, 2026
@multiplayer-app/session-debugger
Advanced tools
The Multiplayer Session Debugger is a powerful tool that offers deep session replays with insights spanning frontend screens, platform traces, metrics, and logs. It helps your team pinpoint and resolve bugs faster by providing a complete picture of your backend system architecture. No more wasted hours combing through APM data; the Multiplayer Session Debugger does it all in one place.
You can install the Multiplayer Session Debugger using npm or yarn:
npm install @multiplayer-app/session-debugger
# or
yarn add @multiplayer-app/session-debugger
To initialize the Multiplayer Session Debugger in your application, follow the steps below.
import debuggerInstance from "@multiplayer-app/session-debugger";
Use the following code to initialize the debugger with your application details:
debuggerInstance.init({
  version: "{YOUR_APPLICATION_VERSION}",
  application: "{YOUR_APPLICATION_NAME}",
  environment: "{YOUR_APPLICATION_ENVIRONMENT}",
  apiKey: "{YOUR_API_KEY}",
});
Replace the placeholders with your application’s version, name, environment, and API key (OpenTelemetry Frontend Token).
To track user-specific metadata in session replays, add the following:
window["mpSessionDebuggerMetadata"] = {
  userId: "{userId}",
  userName: "{userName}",
};
Replace the placeholders with the actual user information (e.g., user ID and username).
This library relies on the following packages:
import debuggerInstance from "@multiplayer-app/session-debugger";

debuggerInstance.init({
  version: "1.0.0",
  application: "MyApp",
  environment: "production",
  apiKey: "your-api-key",
  canvasEnabled: true,
  showWidget: true,
  ignoreUrls: [
    /https:\/\/domain\.to\.ignore\/.*/, // can be regex or string
    /https:\/\/another\.domain\.to\.ignore\/.*/,
  ],
  // NOTE: if frontend domain doesn't match to backend one, set backend domain to `propagateTraceHeaderCorsUrls` parameter
  propagateTraceHeaderCorsUrls: [
    new RegExp("https://your.backend.api.domain", "i"), // can be regex or string
    new RegExp("https://another.backend.api.domain", "i")
  ],
  schemifyDocSpanPayload: true,
  maskDebSpanPayload: true,
  docTraceRatio: 0.15 // 15% of traces will be sent for auto-documentation
  maxCapturingHttpPayloadSize: 100000,
  disableCapturingHttpPayload: false
});

window["mpSessionDebuggerMetadata"] = {
  userId: "12345",
  userName: "John Doe",
};
To integrate the SessionDebugger component into your Next.js application, follow these steps:
Create a new file (e.g., SessionDebugger.js or SessionDebugger.tsx) in your root directory or a components directory.
Import the component
In the newly created file, add the following code:
"use client"; // Mark as Client Component
import { useEffect } from "react";
import debuggerInstance from "@multiplayer-app/session-debugger";

export default function SessionDebugger() {
  useEffect(() => {
    if (typeof window !== 'undefined') {
      debuggerInstance.init({
        version: "{YOUR_APPLICATION_VERSION}",
        application: "{YOUR_APPLICATION_NAME}",
        environment: "{YOUR_APPLICATION_ENVIRONMENT}",
        apiKey: "{YOUR_API_KEY}",
      });

      window["mpSessionDebuggerMetadata"] = {
        userId: "{userId}",
        userName: "{userName}",
      };
    }
  }, []);

  return null; // No UI output needed
}
Replace the placeholders with the actual information.
Now, you can use the SessionDebugger component in your application by adding it to your desired page or layout file:
import SessionDebugger from './SessionDebugger'; // Adjust the path as necessary

export default function MyApp() {
  return (
    <>
      <SessionDebugger />
      {/* Other components */}
    </>
  );
}
If frontend domain doesn't match to backend one, set backend domain to propagateTraceHeaderCorsUrls parameter:
import debuggerInstance from "@multiplayer-app/session-debugger";

debuggerInstance.init({
  version: "{YOUR_APPLICATION_VERSION}",
  application: "{YOUR_APPLICATION_NAME}",
  environment: "{YOUR_APPLICATION_ENVIRONMENT}",
  apiKey: "{YOUR_API_KEY}",
  propagateTraceHeaderCorsUrls: new RegExp(`https://your.backend.api.domain`, 'i')
});
If frontend sends api requests to two or more different domains put them to propagateTraceHeaderCorsUrls as array:
import debuggerInstance from "@multiplayer-app/session-debugger";

debuggerInstance.init({
  version: "{YOUR_APPLICATION_VERSION}",
  application: "{YOUR_APPLICATION_NAME}",
  environment: "{YOUR_APPLICATION_ENVIRONMENT}",
  apiKey: "{YOUR_API_KEY}",
  propagateTraceHeaderCorsUrls: [
    new RegExp(`https://your.backend.api.domain`, 'i'),
    new RegExp(`https://another.backend.api.domain`, 'i')
  ]
});
For more details on how the Multiplayer Session Debugger integrates with your backend architecture and system auto-documentation, check out our official documentation.
This library is distributed under the MIT License.
FAQs
Multiplayer session debugger
We found that @multiplayer-app/session-debugger demonstrated a healthy version release cadence and project activity because the last version was released less than a year ago. It has 4 open source maintainers collaborating on the project.
Did you know?

Socket for GitHub automatically highlights issues in each pull request and monitors the health of all your open source dependencies. Discover the contents of your packages and block harmful activity before you install or update your dependencies.
Security News
Federal audit finds NIST lacked a plan to clear the NVD backlog, wasted funds on duplicate work, and delayed use of CISA data.
Research
/Security News
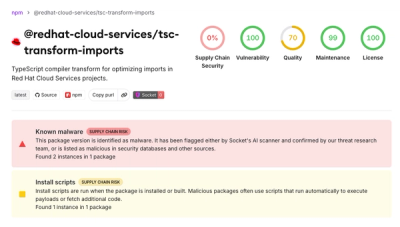
A mini Shai-Hulud campaign compromised Red Hat Cloud Services npm packages to steal developer and CI/CD secrets during installation.

Research
/Security News
The North Korean malware loader hides in a Packagist-listed package and its GitHub branch to fetch and execute remote code in a likely Contagious Interview-style lure.