
Security News
Federal Audit Finds NIST Wasted Funds With No Plan to Clear NVD Backlog
Federal audit finds NIST lacked a plan to clear the NVD backlog, wasted funds on duplicate work, and delayed use of CISA data.
By Sarah Gooding - Jun 03, 2026
@neabyte/chart-to-image
Advanced tools
Convert trading charts to images using Node.js canvas with advanced features: 6 chart types, VWAP/EMA/SMA indicators, custom colors, themes, hide elements, scaling, and PNG/JPEG export formats.


![]()
![]()
Convert trading charts to images using Node.js Canvas, lightweight-charts, and CCXT. A powerful Node.js library for generating high-quality trading chart images from market data.

| Candlestick | Line | Area |
|---|---|---|
 |  |  |
| Heikin-Ashi | Renko |
|---|---|
 |  |


npm install @neabyte/chart-to-image
# Basic chart generation
npx @neabyte/chart-to-image --symbol BTC/USDT --output chart.png

# Custom timeframe and dimensions
npx @neabyte/chart-to-image -s ETH/USDT -t 4h -o eth-chart.png -w 1200 -h 800

# With custom theme and colors
npx @neabyte/chart-to-image -s BTC/USDT -o chart.png --theme dark --background-color "#1a1a2e" --text-color "#00d4ff"

# Advanced chart types
npx @neabyte/chart-to-image -s ETH/USDT -o heikin-ashi.png --chart-type heikin-ashi
npx @neabyte/chart-to-image -s BTC/USDT -o renko.png --chart-type renko
npx @neabyte/chart-to-image -s BTC/USDT -o line-break.png --chart-type line-break

# Technical indicators
npx @neabyte/chart-to-image -s BTC/USDT -o vwap-chart.png --vwap
npx @neabyte/chart-to-image -s ETH/USDT -o ema-chart.png --ema
npx @neabyte/chart-to-image -s BTC/USDT -o sma-chart.png --sma
npx @neabyte/chart-to-image -s BTC/USDT -o indicators.png --vwap --ema --sma

# Bollinger Bands with custom colors
npx @neabyte/chart-to-image -s BTC/USDT -o bb-chart.png --bb
npx @neabyte/chart-to-image -s ETH/USDT -o bb-custom.png --bb --bb-upper-color "#ff6b9d" --bb-middle-color "#4ecdc4" --bb-lower-color "#ff6b9d" --bb-background-color "#ff6b9d" --bb-background-opacity 0.2
npx @neabyte/chart-to-image -s BTC/USDT -o bb-line.png --bb --chart-type line --bb-upper-color "#9b59b6" --bb-middle-color "#f39c12" --bb-lower-color "#9b59b6" --bb-background-color "#9b59b6" --bb-background-opacity 0.25

# All indicators together
npx @neabyte/chart-to-image -s BTC/USDT -o all-indicators.png --vwap --ema --sma --bb

# Chart comparison (side-by-side)
npx @neabyte/chart-to-image --compare "BTC/USDT,ETH/USDT" --output comparison.png

# Timeframe comparison (same symbol, different timeframes)
npx @neabyte/chart-to-image --compare "BTC/USDT,BTC/USDT" --timeframes "1h,4h" --output timeframe-comparison.png

# Grid comparison with custom colors
npx @neabyte/chart-to-image --compare "BTC/USDT,ETH/USDT" --layout grid --custom-colors "bullish=#00ff88,bearish=#ff4444" --output grid-comparison.png

# Comparison with indicators
npx @neabyte/chart-to-image --compare "BTC/USDT,ETH/USDT" --vwap --ema --output comparison-indicators.png

# Comparison with Bollinger Bands
npx @neabyte/chart-to-image --compare "BTC/USDT,ETH/USDT" --bb --output comparison-bb.png
npx @neabyte/chart-to-image --compare "BTC/USDT,ETH/USDT" --bb --bb-upper-color "#ff6b9d" --bb-middle-color "#4ecdc4" --bb-lower-color "#ff6b9d" --bb-background-color "#ff6b9d" --bb-background-opacity 0.2 --output comparison-bb-custom.png

# Hide elements for clean charts
npx @neabyte/chart-to-image -s ADA/USDT -o clean.png --hide-title --hide-time-axis --hide-grid
import { quickChart, generateChartImage, fetchMarketData, ComparisonService } from '@neabyte/chart-to-image'

// Quick chart generation
const result = await quickChart('BTC/USDT', 'chart.png', {
  timeframe: '1h',
  width: 1200,
  height: 800,
  theme: 'dark'
})

// Advanced configuration
const config = {
  symbol: 'ETH/USDT',
  timeframe: '4h',
  exchange: 'binance',
  outputPath: 'eth-chart.png',
  width: 1000,
  height: 600,
  theme: 'light',
  chartType: 'heikin-ashi',
  backgroundColor: '#1a1a2e',
  textColor: '#00d4ff',
  customBarColors: {
    bullish: '#00ff88',
    bearish: '#ff4444',
    wick: '#ffffff',
    border: '#333333'
  },
  showTitle: false,
  showTimeAxis: false,
  showGrid: false
}

const result = await generateChartImage(config)

// Chart comparison
const comparisonResult = await ComparisonService.sideBySide(
  ['BTC/USDT', 'ETH/USDT'],
  'comparison.png'
)

// Timeframe comparison
const timeframeResult = await ComparisonService.timeframeComparison(
  'BTC/USDT',
  ['1h', '4h', '1d'],
  'timeframe-comparison.png'
)

// Grid comparison with custom colors
const gridResult = await ComparisonService.grid(
  ['BTC/USDT', 'ETH/USDT'],
  2,
  'grid-comparison.png',
  {
    customBarColors: {
      bullish: '#00ff88',
      bearish: '#ff4444'
    }
  }
)

// Chart with technical indicators
const indicatorResult = await generateChartImage({
  symbol: 'BTC/USDT',
  timeframe: '1h',
  outputPath: 'indicators.png',
  showVWAP: true,
  showEMA: true,
  emaPeriod: 20,
  showSMA: true,
  smaPeriod: 20
})

// Chart with Bollinger Bands
const bbResult = await generateChartImage({
  symbol: 'BTC/USDT',
  timeframe: '1h',
  outputPath: 'bb-chart.png',
  showBollingerBands: true,
  bbPeriod: 20,
  bbStandardDeviations: 2,
  bbColors: {
    upper: '#ff6b9d',
    middle: '#4ecdc4',
    lower: '#ff6b9d',
    background: '#ff6b9d',
    backgroundOpacity: 0.2
  }
})

// All indicators together
const allIndicatorsResult = await generateChartImage({
  symbol: 'BTC/USDT',
  timeframe: '1h',
  outputPath: 'all-indicators.png',
  showVWAP: true,
  showEMA: true,
  emaPeriod: 20,
  showSMA: true,
  smaPeriod: 20,
  showBollingerBands: true,
  bbPeriod: 20,
  bbStandardDeviations: 2,
  bbColors: {
    upper: '#ff6b9d',
    middle: '#4ecdc4',
    lower: '#ff6b9d',
    background: '#ff6b9d',
    backgroundOpacity: 0.2
  }
})

// Comparison with indicators
const comparisonWithIndicators = await ComparisonService.sideBySide(
  ['BTC/USDT', 'ETH/USDT'],
  'comparison-indicators.png',
  {
    showVWAP: true,
    showEMA: true,
    emaPeriod: 20,
    showSMA: true,
    smaPeriod: 20
  }
)

// Comparison with Bollinger Bands
const comparisonWithBB = await ComparisonService.sideBySide(
  ['BTC/USDT', 'ETH/USDT'],
  'comparison-bb.png',
  {
    showBollingerBands: true,
    bbPeriod: 20,
    bbStandardDeviations: 2,
    bbColors: {
      upper: '#ff6b9d',
      middle: '#4ecdc4',
      lower: '#ff6b9d',
      background: '#ff6b9d',
      backgroundOpacity: 0.2
    }
  }
)
# Hex colors
--background-color "#1a1a2e" --text-color "#00d4ff"

# RGB colors
--background-color "rgb(25, 25, 112)" --text-color "rgb(255, 215, 0)"

# Named colors
--background-color "midnightblue" --text-color "gold"

# Gradients
--background-color "linear-gradient(135deg, #667eea 0%, #764ba2 100%)"
# Hide title
--hide-title

# Hide time axis
--hide-time-axis

# Hide grid
--hide-grid

# Hide all elements
--hide-title --hide-time-axis --hide-grid
# Auto-scaling
--auto-scale

# Manual scaling
--scale-x 1.2 --scale-y 1.1

# Price limits
--min-scale 45000 --max-scale 50000
For complete usage guide with detailed examples, see USAGE.md 📚
git clone https://github.com/NeaByteLab/Chart-To-Image.git
cd Chart-To-Image
npm install
npm run build
npm run dev
npm test
npm run lint
npm run lint:fix
src/
├── core/
│   ├── config.ts         # Chart configuration
│   └── renderer.ts       # Chart rendering engine
├── renderer/
│   ├── charts.ts         # Chart type renderers
│   ├── elements.ts       # Chart elements (axes, grid, etc.)
│   ├── index.ts          # Main renderer orchestrator
│   ├── types.ts          # Renderer types
│   └── utils.ts          # Renderer utilities
├── types/
│   └── types.ts          # TypeScript type definitions
├── utils/
│   ├── cli.ts            # CLI argument parsing
│   ├── exporter.ts       # Image export utilities
│   ├── provider.ts       # Market data fetching
│   └── utils.ts          # Chart data utilities
├── index.ts              # Main API exports
└── cli.ts                # Command line interface
MIT License - see LICENSE file for details.
FAQs
Convert trading charts to images using Node.js canvas with advanced features: 6 chart types, VWAP/EMA/SMA indicators, custom colors, themes, hide elements, scaling, and PNG/JPEG export formats.
We found that @neabyte/chart-to-image demonstrated a healthy version release cadence and project activity because the last version was released less than a year ago. It has 1 open source maintainer collaborating on the project.
Did you know?

Socket for GitHub automatically highlights issues in each pull request and monitors the health of all your open source dependencies. Discover the contents of your packages and block harmful activity before you install or update your dependencies.
Security News
Federal audit finds NIST lacked a plan to clear the NVD backlog, wasted funds on duplicate work, and delayed use of CISA data.
Research
/Security News
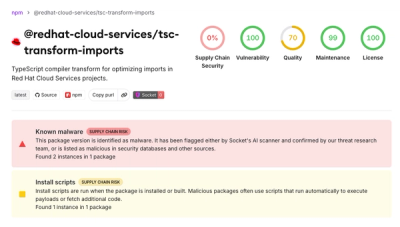
A mini Shai-Hulud campaign compromised Red Hat Cloud Services npm packages to steal developer and CI/CD secrets during installation.

Research
/Security News
The North Korean malware loader hides in a Packagist-listed package and its GitHub branch to fetch and execute remote code in a likely Contagious Interview-style lure.