Product
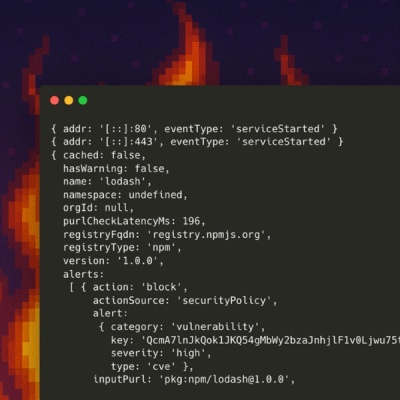
Introducing Socket Firewall Enterprise: Flexible, Configurable Protection for Modern Package Ecosystems
Socket Firewall Enterprise is now available with flexible deployment, configurable policies, and expanded language support.
@nebula.js/sn-gauge
Advanced tools
The gauge is often used to present KPIs, that is a single measure value, in the form of a radial gauge or a bar gauge.

Requires @nebula.js/stardust version 1.2.0 or later.
If you use npm: npm install @nebula.js/sn-gauge.
You can also load through the script tag directly from
https://unpkg.com.
const nebula = embed(app, {
  context: { theme: "light" },
  types: [
    {
      name: "gauge",
      load: () => Promise.resolve(gauge),
    },
  ],
});

nebula.render({
  type: "gauge",
  element: document.querySelector(".object"),
  fields: ["=[A Sales $  with measure color]"],
  options: { direction: "ltr", freeResize: true },
  properties: {
    measureAxis: {
      min: 0,
      max: 150000000,
    },
    useSegments: true,
    color: { useBaseColors: "off" },
    segmentInfo: {
      limits: [
        {
          value: { qValueExpression: { qExpr: "Sum ([Sales Amount])*0.8" } },
          gradient: false,
        },
        {
          value: { qValueExpression: { qExpr: "Sum ([Sales Amount])*1.2" } },
          gradient: false,
        },
      ],
      paletteColors: [{ color: "#EE4266" }, { color: "#FFD23F" }, { color: "#337357" }],
    },
  },
});
You can decorate the labels of the radial gauge in
the previous example with more styles (font family and color),
by adding styling "components" into the "properties" of the gauge.
Also, for the sake of demonstration
the direction of the chart is changed from "ltr" to "rtl",
and the axis spacing is made narrow (that is more ticks along the curved axis).

nebula.render({
  type: "gauge",
  element: document.querySelector(".object"),
  fields: ["=[A Sales $  with measure color]"],
  options: { direction: "rtl" },
  properties: {
    measureAxis: {
      min: 0,
      max: 150000000,
      spacing: 0.5,
    },
    useSegments: true,
    color: { useBaseColors: "off" },
    segmentInfo: {
      limits: [
        {
          value: { qValueExpression: { qExpr: "Sum ([Sales Amount])*0.8" } },
          gradient: false,
        },
        {
          value: { qValueExpression: { qExpr: "Sum ([Sales Amount])*1.2" } },
          gradient: false,
        },
      ],
      paletteColors: [{ color: "#EE4266" }, { color: "#FFD23F" }, { color: "#337357" }],
    },
    components: [
      {
        key: "axis",
        axis: {
          title: {
            fontFamily: "Montserrat, sans-serif",
            color: { color: "#bb3e00" },
          },
          label: {
            name: {
              color: { color: "#657c6a" },
              fontFamily: "Open Sans, sans-serif",
            },
          },
        },
      },
      {
        key: "value",
        label: {
          value: {
            color: { color: "#f7ad45" },
            fontFamily: "Roboto, sans-serif",
          },
        },
      },
    ],
  },
});
You can combine segments and reference lines to clearly put the measured value in context.
In the example below, you can compare the current sales value with the value of last year and with the expected value. The segments colors indicate which range the current value falls into, and the reference lines and labels provide information about the referenced values.

nebula.render({
  type: "gauge",
  element: document.querySelector(".object"),
  fields: ["=[A Sales $  with measure color]"],
  properties: {
    gaugetype: "bar",
    measureAxis: { min: 0, max: 150000000 },
    useSegments: true,
    color: { useBaseColors: "off" },
    segmentInfo: {
      limits: [
        { value: 91000000, gradient: false },
        { value: 101000000, gradient: false },
      ],
      paletteColors: [{ color: "#EE4266" }, { color: "#FFD23F" }, { color: "#337357" }],
    },
    refLine: {
      refLines: [
        {
          label: "Last year sales",
          refLineExpr: { value: 91000000, label: "91000000" },
          paletteColor: { color: "#cc3c5b" },
        },
        {
          label: "Expectation",
          refLineExpr: { value: 101000000, label: "101000000" },
          paletteColor: { color: "#49bd2b" },
        },
      ],
    },
  },
});
FAQs
A gauge chart
We found that @nebula.js/sn-gauge demonstrated a healthy version release cadence and project activity because the last version was released less than a year ago. It has 7 open source maintainers collaborating on the project.
Did you know?

Socket for GitHub automatically highlights issues in each pull request and monitors the health of all your open source dependencies. Discover the contents of your packages and block harmful activity before you install or update your dependencies.

Product
Socket Firewall Enterprise is now available with flexible deployment, configurable policies, and expanded language support.

Security News
Open source dashboard CNAPulse tracks CVE Numbering Authorities’ publishing activity, highlighting trends and transparency across the CVE ecosystem.

Product
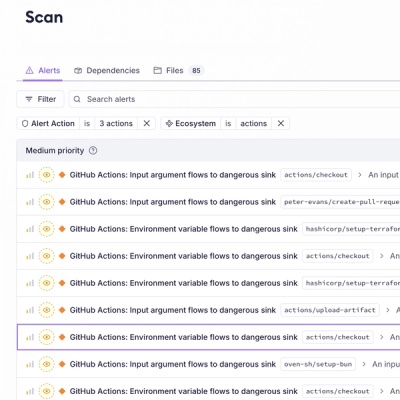
Detect malware, unsafe data flows, and license issues in GitHub Actions with Socket’s new workflow scanning support.