Security News
/Research
Wallet-Draining npm Package Impersonates Nodemailer to Hijack Crypto Transactions
Malicious npm package impersonates Nodemailer and drains wallets by hijacking crypto transactions across multiple blockchains.
@opencensus/core
Advanced tools
OpenCensus is a toolkit for collecting application performance and behavior data.
The @opencensus/core package is a set of libraries for collecting, processing, and exporting telemetry data (metrics and traces) for analysis to improve the performance and reliability of applications. It is part of the OpenCensus project, which aims to provide a single, high-quality telemetry collection framework across multiple languages.
Tracing
This feature allows the collection and export of trace data, which helps in understanding the flow of requests through various services and in identifying bottlenecks and latency issues.
const { Tracing } = require('@opencensus/core');
const tracing = Tracing.instance;
// Configure tracing
tracing.start({samplingRate: 1});
// Create a custom span
const rootSpan = tracing.tracer.startRootSpan({name: 'main'}, rootSpan => {
// Do work within the span
rootSpan.end(); // End the span
});Metrics
This feature enables the collection and aggregation of metrics data, such as counts or latencies, which can be used for monitoring application performance and health.
const { Metrics, MeasureUnit } = require('@opencensus/core');
const metrics = Metrics.instance;

// Create a measure
const requestCountMeasure = metrics.createMeasureInt64('request_count', MeasureUnit.UNIT, 'Count of requests received');

// Create and register a view to aggregate the data
metrics.createView('request_count_view', requestCountMeasure, 'count', [], 'The count of requests', []);

// Record data
metrics.record([{measure: requestCountMeasure, value: 1}]);The prom-client package is specifically designed for creating metrics in the Prometheus format. It focuses solely on metrics collection and exposition, unlike @opencensus/core, which supports both tracing and metrics. This makes prom-client a good choice if you are specifically looking for Prometheus support, but it lacks the tracing capabilities of @opencensus/core.
OpenCensus for Node.js is an implementation of OpenCensus, a toolkit for collecting application performance and behavior monitoring data. It currently includes 3 apis: stats, tracing and tags.
The library is in alpha stage and the API is subject to change.
Install the opencensus-core package with NPM:
npm install @opencensus/core
To enable metrics, we’ll import a few items from OpenCensus Core package.
const { globalStats, MeasureUnit, AggregationType, TagMap } = require('@opencensus/core');

// The latency in milliseconds
const mLatencyMs = globalStats.createMeasureDouble(
  "repl/latency",
  MeasureUnit.MS,
  "The latency in milliseconds"
);
We now determine how our metrics will be organized by creating Views. We will also create the variable needed to add extra text meta-data to our metrics – methodTagKey, statusTagKey, and errorTagKey.
const methodTagKey = { name: "method" };
const statusTagKey = { name: "status" };
const errorTagKey = { name: "error" };

// Create & Register the view.
const latencyView = globalStats.createView(
  "demo/latency",
  mLatencyMs,
  AggregationType.DISTRIBUTION,
  [methodTagKey, statusTagKey, errorTagKey],
  "The distribution of the latencies",
  // Bucket Boundaries:
  // [>=0ms, >=25ms, >=50ms, >=75ms, >=100ms, >=200ms, >=400ms, >=600ms, >=800ms, >=1s, >=2s, >=4s, >=6s]
  [0, 25, 50, 75, 100, 200, 400, 600, 800, 1000, 2000, 4000, 6000]
);
globalStats.registerView(latencyView);
Now we will record the desired metrics. To do so, we will use globalStats.record() and pass in measurements.
const [_, startNanoseconds] = process.hrtime();
const tags = new TagMap();
tags.set(methodTagKey, { value: "REPL" });
tags.set(statusTagKey, { value: "OK" });

globalStats.record([{
  measure: mLatencyMs,
  value: sinceInMilliseconds(startNanoseconds)
}], tags);

function sinceInMilliseconds(startNanoseconds) {
  const [_, endNanoseconds] = process.hrtime();
  return (endNanoseconds - startNanoseconds) / 1e6;
}
Measures can be of type Int64 or DOUBLE, created by calling createMeasureInt64 and createMeasureDouble respectively. Its units can be:
| MeasureUnit | Usage |
|---|---|
UNIT | for general counts |
BYTE | bytes |
KBYTE | Kbytes |
SEC | seconds |
MS | millisecond |
NS | nanosecond |
Views can have agregations of type SUM, LAST_VALUE, COUNT and DISTRIBUTION. To know more about Stats core concepts, please visit: https://opencensus.io/core-concepts/metrics/
See Quickstart/Metrics for a full example of registering and collecting metrics.
Apache License 2.0
0.1.0 - 2021-07-27
FAQs
OpenCensus is a toolkit for collecting application performance and behavior data.
The npm package @opencensus/core receives a total of 446,977 weekly downloads. As such, @opencensus/core popularity was classified as popular.
We found that @opencensus/core demonstrated a not healthy version release cadence and project activity because the last version was released a year ago. It has 6 open source maintainers collaborating on the project.
Did you know?

Socket for GitHub automatically highlights issues in each pull request and monitors the health of all your open source dependencies. Discover the contents of your packages and block harmful activity before you install or update your dependencies.

Security News
/Research
Malicious npm package impersonates Nodemailer and drains wallets by hijacking crypto transactions across multiple blockchains.

Security News
This episode explores the hard problem of reachability analysis, from static analysis limits to handling dynamic languages and massive dependency trees.

Security News
/Research
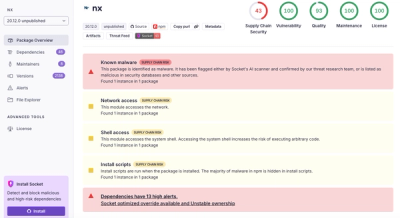
Malicious Nx npm versions stole secrets and wallet info using AI CLI tools; Socket’s AI scanner detected the supply chain attack and flagged the malware.