Playwright OpenTelemetry Trace Viewer


A trace viewer designed around tests, part of Playwright OpenTelemetry. A hosted copy runs at trace.endform.dev.
Overview
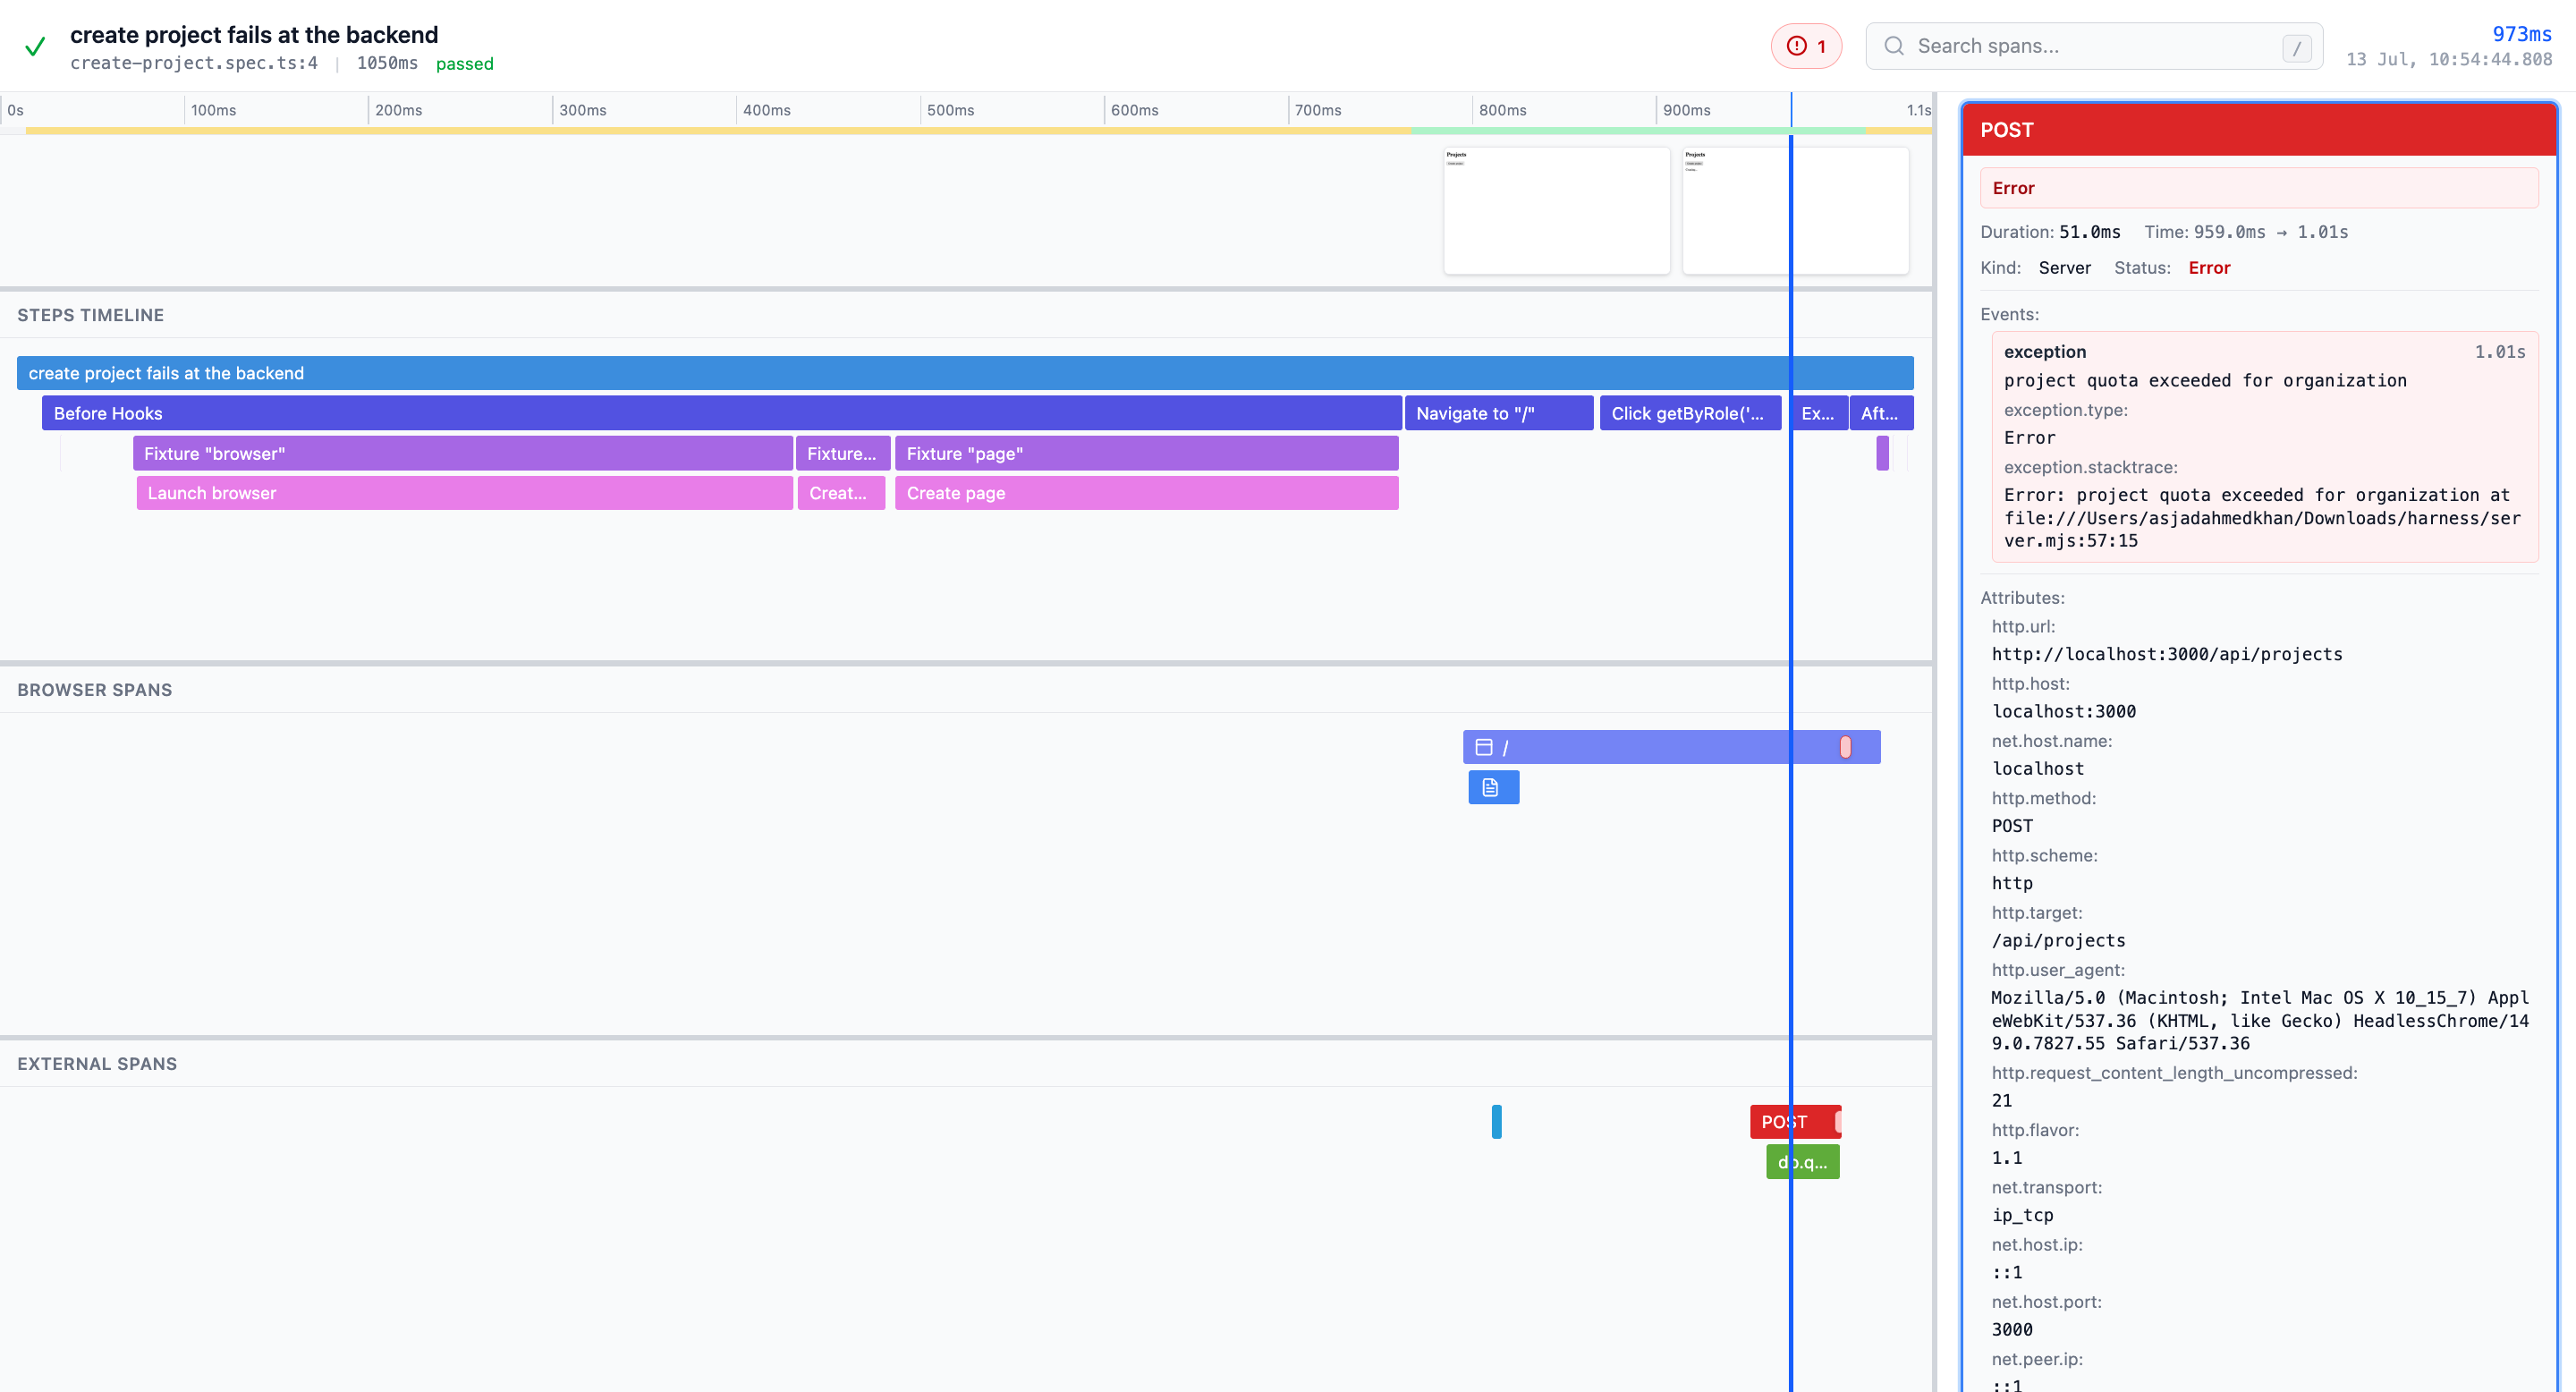
The viewer reads OpenTelemetry trace data directly rather than a proprietary test-result format. The layout uses a time-aligned flame graph with a screenshot filmstrip above it, separated into three views that match how you investigate a failure:
- Test steps for the Playwright test, hooks, fixtures, and actions
- Browser spans for navigation, routes, JavaScript, fonts, images, fetches, and other requests
- External spans for your instrumented application and backend services
Console messages and uncaught browser errors appear as span events on the timeline. You can search span names and attributes, inspect span details and events, jump between errors, and zoom into a time range, while the screenshots stay synchronized with the timeline and grouped by browser context and page.
Run the trace viewer
To boot the trace viewer on localhost:9294:
npx @playwright-opentelemetry/trace-viewer
The viewer can load a local trace zip or a trace-specific API base URL such as /playwright-otel-trace-viewer/v1/{traceId}. Remote API loading fetches {baseUrl}/traces once for the merged OTLP export, derives test metadata from the root playwright.test span, then downloads {baseUrl}/screenshots.zip into the service worker when screenshots are needed.
If the viewer URL includes traceToken, the token is propagated to remote Trace API requests as a query parameter:
https://trace.endform.dev/?traceSource=https%3A%2F%2Fexample.com%2Fplaywright-otel-trace-viewer%2Fv1%2F{traceId}&traceToken={token}
This loads {baseUrl}/traces?traceToken={token} and {baseUrl}/screenshots.zip?traceToken={token}.
The token can also be embedded in the traceSource URL, or in a Trace API URL entered in the load form. The viewer normalizes those forms back to the canonical top-level traceToken query parameter.
The remote API contract is:
GET {baseUrl}/traces returns { "resourceSpans": [...] } or 404 when the trace does not existGET {baseUrl}/screenshots.zip returns a ZIP with root manifest.json and screenshots/*, or 404 when there are no screenshots
The service worker exposes internal per-screenshot URLs to the viewer after loading the ZIP.
Deploy Your Own
Cloudflare
You can deploy a copy of the trace viewer to Cloudflare:
git clone https://github.com/endformdev/playwright-opentelemetry.git
cd playwright-opentelemetry/trace-viewer

pnpm install
pnpm build
pnpm deploy
Custom Base Path (Optional)
If you want to build with absolute paths for a specific deployment location:
TRACE_VIEWER_BASE=/trace-viewer/ pnpm build
Local Development
pnpm install
pnpm dev