
Security News
Meet Socket at Black Hat Europe and BSides London 2025
Socket is heading to London! Stop by our booth or schedule a meeting to see what we've been working on.
By Anders Søndergaard - Nov 11, 2025
@postlight/react-google-sheet-to-chart
Advanced tools
Postlight's React Google Sheet to Chart React component transforms Google Sheets to attractive charts in your webapp with minimal effort. Read all about it in this handy introduction.
Try it now at the demo site and check out the demo site GitHub repository.
The package can be installed via NPM:
npm install @postlight/react-google-sheet-to-chart --save
# or
yarn add @postlight/react-google-sheet-to-chart
To use this component, you'll need a Google API key. First enable Google Sheets API and then generate the API Key here and restrict it to HTTP referrers (web sites).
Second, you'll need a Google Sheet containing the data you wish to plot. (Be sure to check out the spreadsheet format guidelines.)
Finally, import the React component and initialize it with at least three required props:
id: Spreadsheet ID, e.g. 1RE_JYUCXBXY2LNV5Tp5GegLnMue-CpfTVMxjdudZ8Js (extractable from a Google sheet URL)sheet: Sheet name to parse data from, e.g. Sheet1token: The Google API key you created aboveimport RoboChart from '@postlight/react-google-sheet-to-chart';
// ...your component code and then...
<RoboChart
id="GOOGLE_SPREADSHEET_ID"
sheet="Sheet1"
token="GENERATED_GOOGLE_API_KEY"
/>;
yarn create react-app my-app
cd my-app
yarn add @postlight/react-google-sheet-to-chart
App.js and replace GOOGLE_SPREADSHEET_ID and GENERATED_GOOGLE_API_KEY with appropriate values:import React, { Component } from 'react';
import RoboChart from '@postlight/react-google-sheet-to-chart';
import './App.css';
const style = { width: '1200px', margin: '0 auto' };
class App extends Component {
render() {
return (
<div style={style}>
<RoboChart
id="GOOGLE_SPREADSHEET_ID"
sheet="Sheet1"
token="GENERATED_GOOGLE_API_KEY"
/>
</div>
);
}
}
export default App;
yarn start
start e.g. "A5" (start and end create a custom range for your data)end e.g. "E15"title This is the chart title, e.g. "My Accounts"flipAxis default: {false}startFrom default: {0}stacked Use only with type bar, default: {false}type default: "line", should be one of: "line", "bar", "horizontalBar", "pie", "semi-pie", "doughnut", "semi-doughnut"colors e.g. {['#a1a1a1', '#434343', '#ff0055']}xsuffix Add a suffix to x-Axis labels, e.g. " USD"ysuffix Add a suffix to y-Axis labelsExample:
<RoboChart
  id="GOOGLE_SPREADSHEET_ID"
  sheet="Companies Values"
  token="GENERATED_GOOGLE_API_KEY"
  type="semi-pie"
  title="Companies values in Billion $"
  colors={['#a1a1a1', '#995500', '#990055', '#009955']}
/>
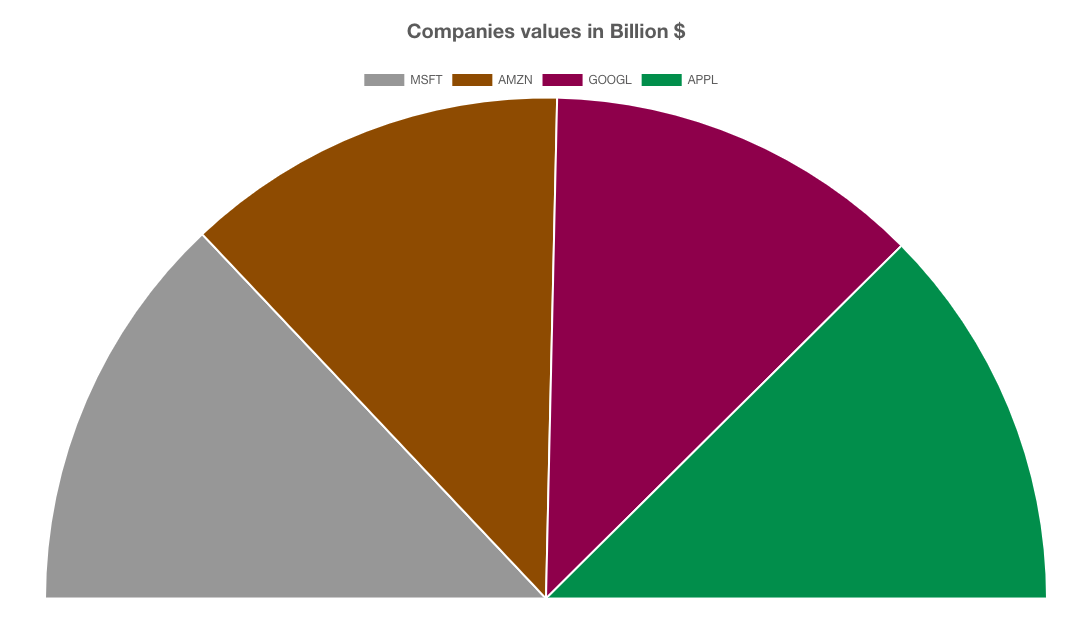
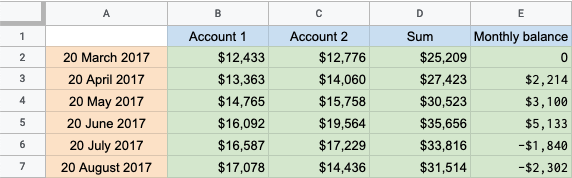
In order to successfuly generate a chart, the Spreadsheet should have Row titles, Column titles and Values, example:
Licensed under either of the below, at your preference:
Unless it is explicitly stated otherwise, any contribution intentionally submitted for inclusion in the work, as defined in the Apache-2.0 license, shall be dual licensed as above without any additional terms or conditions.
🔬 A Labs project from your friends at Postlight. Happy coding!
FAQs
Transform Google sheets to pretty charts!
The npm package @postlight/react-google-sheet-to-chart receives a total of 5 weekly downloads. As such, @postlight/react-google-sheet-to-chart popularity was classified as not popular.
We found that @postlight/react-google-sheet-to-chart demonstrated a not healthy version release cadence and project activity because the last version was released a year ago. It has 7 open source maintainers collaborating on the project.
Did you know?

Socket for GitHub automatically highlights issues in each pull request and monitors the health of all your open source dependencies. Discover the contents of your packages and block harmful activity before you install or update your dependencies.
Security News
Socket is heading to London! Stop by our booth or schedule a meeting to see what we've been working on.

Security News
OWASP’s 2025 Top 10 introduces Software Supply Chain Failures as a new category, reflecting rising concern over dependency and build system risks.

Research
/Security News
Socket researchers discovered nine malicious NuGet packages that use time-delayed payloads to crash applications and corrupt industrial control systems.