
Product
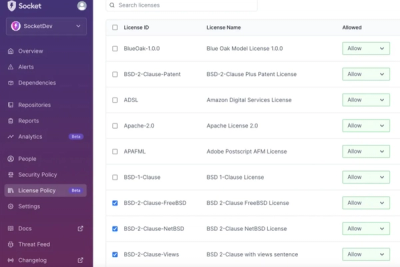
Introducing License Enforcement in Socket
Ensure open-source compliance with Socket’s License Enforcement Beta. Set up your License Policy and secure your software!
By Philipp Burckhardt - Oct 17, 2024
@yeger/turbo-graph-ui
Advanced tools
Interactive visualization of Turborepo task graphs.

npm install --save-dev @yeger/turbo-graph
# or
yarn add -D @yeger/turbo-graph
# or
pnpm install -D @yeger/turbo-graph
The visualization can be opened by running this package's turbo-graph command.
For simple usage, create a script in your root package.json.
{
  "script": {
    "graph": "turbo-graph"
  }
}
Nodes represent your workspaces, i.e., packages. Each workspace can have multiple nodes, each color defining the corresponding task (as seen in the toolbar).
-o, --open: Open the visualizer in the default browser.-p, --port <port>: Port of the visualizer. (default: 29312)-h, --help: Display help messageBy right-clicking a node, only its (transitive) dependencies and dependents are shown.
Further, the checkboxes allow filtering nodes by their corresponding tasks.
The graph can be zoomed using the mouse-wheel and nodes may be dragged while holding the left mouse-button.
The "Reset" button centers the graph.
MIT - Copyright © Jan Müller
FAQs
Interactive visualization of Turborepo task graphs.
The npm package @yeger/turbo-graph-ui receives a total of 599 weekly downloads. As such, @yeger/turbo-graph-ui popularity was classified as not popular.
We found that @yeger/turbo-graph-ui demonstrated a healthy version release cadence and project activity because the last version was released less than a year ago. It has 0 open source maintainers collaborating on the project.
Did you know?

Socket for GitHub automatically highlights issues in each pull request and monitors the health of all your open source dependencies. Discover the contents of your packages and block harmful activity before you install or update your dependencies.
Product
Ensure open-source compliance with Socket’s License Enforcement Beta. Set up your License Policy and secure your software!
Product
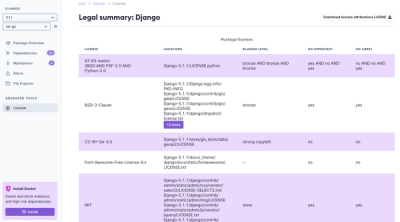
We're launching a new set of license analysis and compliance features for analyzing, managing, and complying with licenses across a range of supported languages and ecosystems.
Product
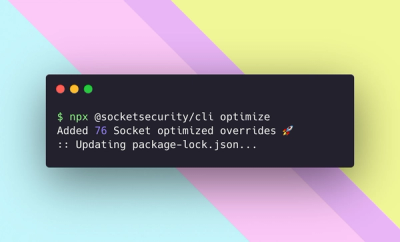
We're excited to introduce Socket Optimize, a powerful CLI command to secure open source dependencies with tested, optimized package overrides.