angular2-google-chart
Advanced tools
angular2-google-chart - npm Package Compare versions
Comparing version 2.1.1 to 2.2.1
@@ -30,3 +30,3 @@ System.register(["@angular/core"], function (exports_1, context_1) { | ||
| googleLoaded = true; | ||
| google.charts.load('current', { 'packages': ['corechart', 'gauge'] }); | ||
| google.charts.load('current', { 'packages': ['corechart', 'gauge']['orgchart'] }); | ||
| } | ||
@@ -33,0 +33,0 @@ setTimeout(function () { return _this.drawGraph(_this.chartOptions, _this.chartType, _this.chartData, _this._element); }, 1000); |
@@ -26,3 +26,3 @@ | ||
| googleLoaded = true; | ||
| google.charts.load('current', {'packages':['corechart', 'gauge']}); | ||
| google.charts.load('current', {'packages':['corechart', 'gauge']['orgchart']}); | ||
| } | ||
@@ -29,0 +29,0 @@ setTimeout(() =>this.drawGraph(this.chartOptions,this.chartType,this.chartData,this._element),1000); |
@@ -88,2 +88,12 @@ /* | ||
| ]; | ||
| this.org_ChartData = [ | ||
| ['Name', 'Manager', 'ToolTip'], | ||
| [{ v: 'Mike', f: 'Mike<div style="color:red; font-style:italic">President</div>' }, | ||
| '', 'The President'], | ||
| [{ v: 'Jim', f: 'Jim<div style="color:red; font-style:italic">Vice President</div>' }, | ||
| 'Mike', 'VP'], | ||
| ['Alice', 'Mike', ''], | ||
| ['Bob', 'Jim', 'Bob Sponge'], | ||
| ['Carol', 'Bob', ''] | ||
| ]; | ||
| this.line_ChartOptions = { | ||
@@ -177,2 +187,5 @@ title: 'Company Performance', | ||
| this.map_ChartOptions = {}; | ||
| this.org_ChartOptions = { | ||
| allowHtml: true | ||
| }; | ||
| } | ||
@@ -184,3 +197,3 @@ return AppComponent; | ||
| selector: 'my-app', | ||
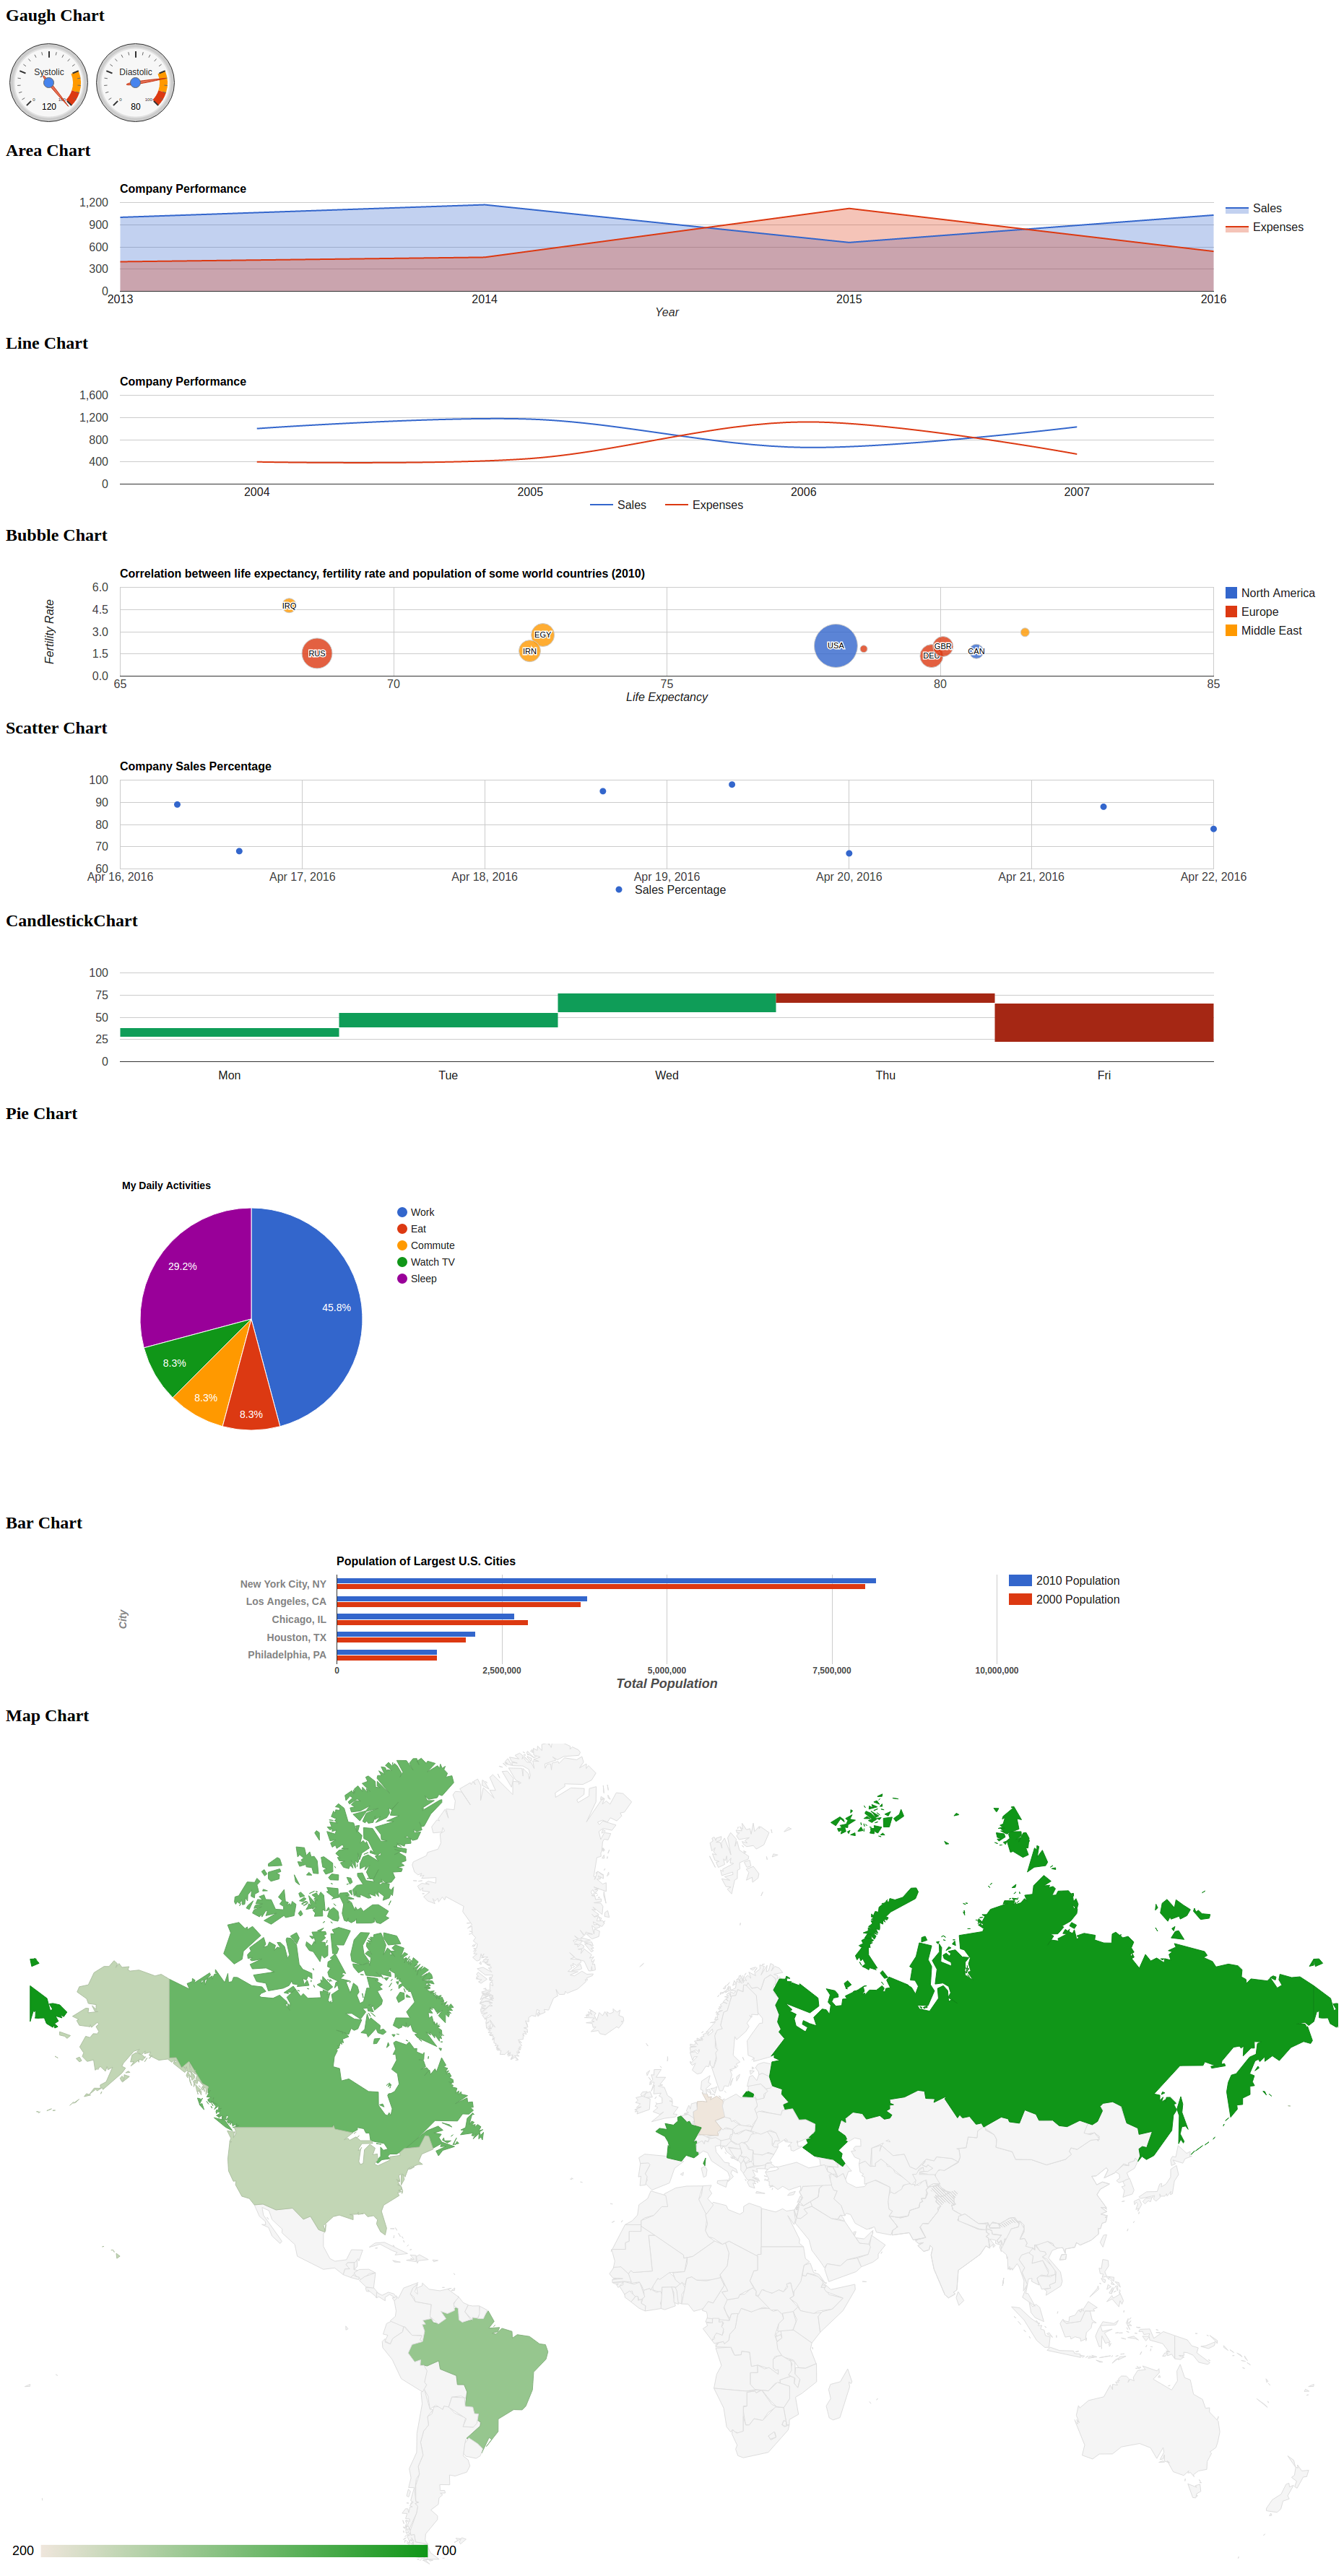
| template: "\n <h2> Gaugh Chart</h2>\n <div id=\"gauge_chart\" [chartData]=\"gauge_ChartData\" [chartOptions]= \"gauge_ChartOptions\" chartType=\"Gauge\" GoogleChart></div>\n <h2> Area Chart</h2>\n <div id=\"area_chart\" [chartData]=\"area_ChartData\" [chartOptions]= \"area_ChartOptions\" chartType=\"AreaChart\" GoogleChart></div>\n <h2> Line Chart</h2>\n <div id=\"line_chart\" [chartData]=\"line_ChartData\" [chartOptions]= \"line_ChartOptions\" chartType=\"LineChart\" GoogleChart></div>\n <h2> Bubble Chart</h2>\n <div id=\"bubble_chart\" [chartData]=\"bubble_ChartData\" [chartOptions] = \"bubble_ChartOptions\" chartType=\"BubbleChart\" GoogleChart></div>\n <h2> Scatter Chart</h2>\n <div id=\"scatter_chart\" [chartData]=\"scatter_ChartData\" [chartOptions] = \"scatter_ChartOptions\" chartType=\"ScatterChart\" GoogleChart></div>\n <h2> CandlestickChart</h2>\n <div id=\"candle_chart\" [chartData]=\"candle_ChartData\" [chartOptions] = \"candle_ChartOptions\" chartType=\"CandlestickChart\" GoogleChart></div>\n <h2> Pie Chart</h2>\n <div id=\"pie_chart\" [chartData]=\"pie_ChartData\" [chartOptions] = \"pie_ChartOptions\" chartType=\"PieChart\" GoogleChart></div>\n <h2> Bar Chart</h2>\n <div id=\"bar_chart\" [chartData]=\"bar_ChartData\" [chartOptions] = \"bar_ChartOptions\" chartType=\"BarChart\" GoogleChart></div>\n <h2> Map Chart</h2>\n <div id=\"map_chart\" [chartData]=\"map_ChartData\" [chartOptions] = \"map_ChartOptions\" chartType=\"GeoChart\" GoogleChart></div>\n\n\t" | ||
| template: "\n <h2> Gaugh Chart</h2>\n <div id=\"gauge_chart\" [chartData]=\"gauge_ChartData\" [chartOptions]= \"gauge_ChartOptions\" chartType=\"Gauge\" GoogleChart></div>\n <h2> Area Chart</h2>\n <div id=\"area_chart\" [chartData]=\"area_ChartData\" [chartOptions]= \"area_ChartOptions\" chartType=\"AreaChart\" GoogleChart></div>\n <h2> Line Chart</h2>\n <div id=\"line_chart\" [chartData]=\"line_ChartData\" [chartOptions]= \"line_ChartOptions\" chartType=\"LineChart\" GoogleChart></div>\n <h2> Bubble Chart</h2>\n <div id=\"bubble_chart\" [chartData]=\"bubble_ChartData\" [chartOptions] = \"bubble_ChartOptions\" chartType=\"BubbleChart\" GoogleChart></div>\n <h2> Scatter Chart</h2>\n <div id=\"scatter_chart\" [chartData]=\"scatter_ChartData\" [chartOptions] = \"scatter_ChartOptions\" chartType=\"ScatterChart\" GoogleChart></div>\n <h2> CandlestickChart</h2>\n <div id=\"candle_chart\" [chartData]=\"candle_ChartData\" [chartOptions] = \"candle_ChartOptions\" chartType=\"CandlestickChart\" GoogleChart></div>\n <h2> Pie Chart</h2>\n <div id=\"pie_chart\" [chartData]=\"pie_ChartData\" [chartOptions] = \"pie_ChartOptions\" chartType=\"PieChart\" GoogleChart></div>\n <h2> Bar Chart</h2>\n <div id=\"bar_chart\" [chartData]=\"bar_ChartData\" [chartOptions] = \"bar_ChartOptions\" chartType=\"BarChart\" GoogleChart></div>\n <h2> Map Chart</h2>\n <div id=\"map_chart\" [chartData]=\"map_ChartData\" [chartOptions] = \"map_ChartOptions\" chartType=\"GeoChart\" GoogleChart></div>\n <h2> Organization Chart</h2>\n <div id=\"org_chart\" [chartData]=\"org_ChartData\" [chartOptions] = \"org_ChartOptions\" chartType=\"OrgChart\" GoogleChart></div>\n\n\t" | ||
| }) | ||
@@ -187,0 +200,0 @@ ], AppComponent); |
@@ -27,2 +27,4 @@ /* | ||
| <div id="map_chart" [chartData]="map_ChartData" [chartOptions] = "map_ChartOptions" chartType="GeoChart" GoogleChart></div> | ||
| <h2> Organization Chart</h2> | ||
| <div id="org_chart" [chartData]="org_ChartData" [chartOptions] = "org_ChartOptions" chartType="OrgChart" GoogleChart></div> | ||
@@ -91,2 +93,12 @@ ` | ||
| ]; | ||
| public org_ChartData = [ | ||
| ['Name', 'Manager', 'ToolTip'], | ||
| [{v:'Mike', f:'Mike<div style="color:red; font-style:italic">President</div>'}, | ||
| '', 'The President'], | ||
| [{v:'Jim', f:'Jim<div style="color:red; font-style:italic">Vice President</div>'}, | ||
| 'Mike', 'VP'], | ||
| ['Alice', 'Mike', ''], | ||
| ['Bob', 'Jim', 'Bob Sponge'], | ||
| ['Carol', 'Bob', ''] | ||
| ]; | ||
| public line_ChartOptions = { | ||
@@ -181,2 +193,5 @@ title: 'Company Performance', | ||
| public map_ChartOptions = {}; | ||
| public org_ChartOptions = { | ||
| allowHtml:true | ||
| }; | ||
| } |
| { | ||
| "name": "angular2-google-chart", | ||
| "version": "2.1.1", | ||
| "version": "2.2.1", | ||
| "description": "google chart directive for angular2", | ||
@@ -5,0 +5,0 @@ "main": "index.js", |
@@ -9,4 +9,3 @@ # Angular2/ Angular 4 | ||
|  | ||
|  | ||
| ## Usage | ||
@@ -37,3 +36,2 @@ | ||
| import {Component} from '@angular/core'; | ||
| @Component({ | ||
@@ -60,4 +58,6 @@ selector: 'my-app', | ||
| <div id="map_chart" [chartData]="map_ChartData" [chartOptions] = "map_ChartOptions" chartType="GeoChart" GoogleChart></div> | ||
| <h2> Organization Chart</h2> | ||
| <div id="org_chart" [chartData]="org_ChartData" [chartOptions] = "org_ChartOptions" chartType="OrgChart" GoogleChart></div> | ||
| ` | ||
| ` | ||
| }) | ||
@@ -124,2 +124,12 @@ export class AppComponent { | ||
| ]; | ||
| public org_ChartData = [ | ||
| ['Name', 'Manager', 'ToolTip'], | ||
| [{ v: 'Mike', f: 'Mike<div style="color:red; font-style:italic">President</div>' }, | ||
| '', 'The President'], | ||
| [{ v: 'Jim', f: 'Jim<div style="color:red; font-style:italic">Vice President</div>' }, | ||
| 'Mike', 'VP'], | ||
| ['Alice', 'Mike', ''], | ||
| ['Bob', 'Jim', 'Bob Sponge'], | ||
| ['Carol', 'Bob', ''] | ||
| ]; | ||
| public line_ChartOptions = { | ||
@@ -214,2 +224,5 @@ title: 'Company Performance', | ||
| public map_ChartOptions = {}; | ||
| public org_ChartOptions = { | ||
| allowHtml: true | ||
| }; | ||
| } | ||
@@ -216,0 +229,0 @@ ``` |
Sorry, the diff of this file is not supported yet
Sorry, the diff of this file is not supported yet
New alerts
License Policy Violation
LicenseThis package is not allowed per your license policy. Review the package's license to ensure compliance.
Found 1 instance in 1 package
Fixed alerts
License Policy Violation
LicenseThis package is not allowed per your license policy. Review the package's license to ensure compliance.
Found 1 instance in 1 package
Improved metrics
- Total package byte prevSize
- increased by0.32%
810600
- Lines of code
- increased by1.11%
2637
- Number of lines in readme file
- increased by5.96%
231