aws-cloudwatch-chart
A node.js module to draw charts for AWS CloudWatch metrics
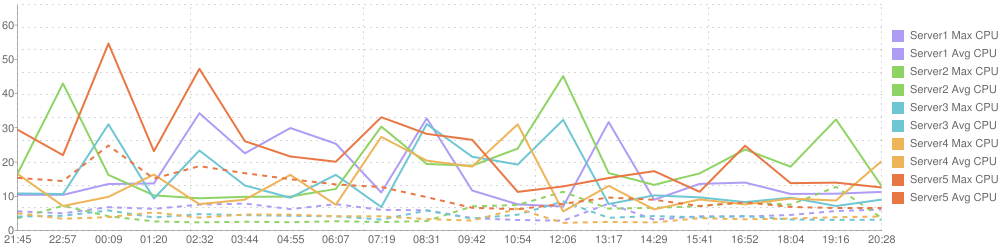
Example chart:
Installation:
npm install aws-cloudwatch-chart
Usage:
var AwsCloudWatchChart = require('aws-cloudwatch-chart');
var config = require('./config.json');
var acs = new AwsCloudWatchChart(config);
acs.getChart().then(function(chart){
chart.save('image.png').then(function(filename){
}
});
or
acs.getChart().then(function(chart){
chart.get().then(function(image){
}
});
config.json example:
{
"metrics": [
{
"title": "Server1 Max CPU",
"namespace": "AWS/EC2",
"metricName": "CPUUtilization",
"statisticValues": "Maximum",
"unit": "Percent",
"color": "af9cf4",
"thickness": 2,
"dashed": false,
"InstanceId": "i-2d55aad0",
}
],
"aws": {
"accessKeyId": "XXXXXXXXXXXXXXXXXX",
"secretAccessKey": "XXXXXX/XXXXXXXXX/XXXXXXXXXXX/XXXXXXXXX",
"region": "us-east-1"
},
"timeOffset": 1440,
"timePeriod": 60,
"chartSamples": 20,
"width": 1000,
"height":250
}
Source
On GitHub
License
MIT