Product
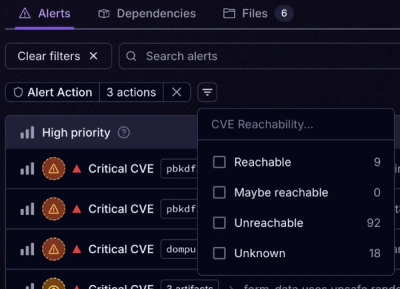
Introducing Tier 1 Reachability: Precision CVE Triage for Enterprise Teams
Socket’s new Tier 1 Reachability filters out up to 80% of irrelevant CVEs, so security teams can focus on the vulnerabilities that matter.
canvas-datagrid-ybg
Advanced tools
Canvas based data grid web component. Capable of displaying millions of contiguous hierarchical rows and columns without paging or loading, on a single canvas element.
Demo - City of Chicago government employee list. Thanks to data.gov.

Slack Support (message author for invite)
Download latest version (minified)
With npm
npm install canvas-datagrid
Place the single source file ./dist/canvas-datagrid.js in your web page using a script tag that points to the source or use webpack.
<script src="dist/canvas-datagrid.js"></script>
Alternatively, instead of downloading and installing, you can link directly to an NPM CDN like unpkg.com.
<script src="https://unpkg.com/canvas-datagrid"></script>
A function will be added to the global scope of the web page called canvasDatagrid as well as module loader definitions.
Works with webpack, without webpack or as a web component.
No matter how you load it, canvasDatagrid is declared in the global scope.
Canvas-datagrid is a Web Component when
in a compatible browser, otherwise it is a <canvas> tag.
var grid = canvasDatagrid();
document.body.appendChild(grid);
grid.data = [
    {col1: 'row 1 column 1', col2: 'row 1 column 2', col3: 'row 1 column 3'},
    {col1: 'row 2 column 1', col2: 'row 2 column 2', col3: 'row 2 column 3'}
];
<canvas-datagrid class="myGridStyle" data="data can go here too">[
    {"col1": "row 1 column 1", "col2": "row 1 column 2", "col3": "row 1 column 3"},
    {"col1": "row 2 column 1", "col2": "row 2 column 2", "col3": "row 2 column 3"}
]</canvas-datagrid>
or
var grid = document.createElement('canvas-datagrid');
grid.data = [
    {"col1": "row 1 column 1", "col2": "row 1 column 2", "col3": "row 1 column 3"},
    {"col1": "row 2 column 1", "col2": "row 2 column 2", "col3": "row 2 column 3"}
];
<canvas-datagrid :data.prop="[{"col1": "row 1 column 1"}]"></canvas-datagrid>
Note about XHR paging demo: Thanks to jservice for the use of the free paging API. You must "load unsafe scripts" or relevant command to allow HTTPS (github) to make XHR requests to HTTP (Jeopardy Questions API). There is nothing unsafe about this.
To install development dependencies. Required to build or test.
npm install
To build production and debug versions.
npm run build-all
To build production version.
npm run build-prd
To build debug version.
npm run build-dev
To build debug version anytime a file in ./lib changes.
npm run build-watch
To build documentation.
npm run build-docs
To run tests. Note: Headless tests will mostly fail due to lack of headless canvas pixel detection support. Use VM testing or your browser.
npm test
FAQs
Canvas based data grid web component. Capable of displaying millions of contiguous hierarchical rows and columns without paging or loading, on a single canvas element.
We found that canvas-datagrid-ybg demonstrated a not healthy version release cadence and project activity because the last version was released a year ago. It has 1 open source maintainer collaborating on the project.
Did you know?

Socket for GitHub automatically highlights issues in each pull request and monitors the health of all your open source dependencies. Discover the contents of your packages and block harmful activity before you install or update your dependencies.

Product
Socket’s new Tier 1 Reachability filters out up to 80% of irrelevant CVEs, so security teams can focus on the vulnerabilities that matter.

Research
/Security News
Ongoing npm supply chain attack spreads to DuckDB: multiple packages compromised with the same wallet-drainer malware.

Security News
The MCP Steering Committee has launched the official MCP Registry in preview, a central hub for discovering and publishing MCP servers.