Product
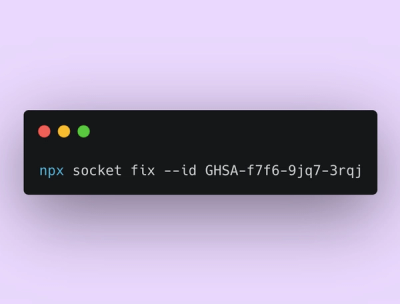
Announcing Socket Fix 2.0
Socket Fix 2.0 brings targeted CVE remediation, smarter upgrade planning, and broader ecosystem support to help developers get to zero alerts.
cpuprofilify
Advanced tools
Converts output of various profiling/sampling tools to the .cpuprofile format so it can be loaded into Chrome DevTools.

Converts output of various profiling/sampling tools to the .cpuprofile format so it can be loaded into Chrome DevTools.

Table of Contents generated with DocToc
npm install -g cpuprofilify
cpuprofilify installs two binary scripts:
profile_1ms.d: DTrace script that samples your process, use either of the following to generate a trace
sudo profile_1ms.d -c 'node --perf-basic-prof <app>' | cpuprofilify > out.cpuprofilesudo profile_1ms.d -p <process id> | cpuprofilify > out.cpuprofilecpuprofilify: which will convert a perf or DTrace trace into a .cpuprofile importable into Chrome DevTools
perf record -e cycles:u -g -- node --perf-basic-prof <app> && perf script | cpuprofilify > out.cpuprofileUse the perf record and perf script commands on Linux to generate input to cpuprofilify and the provided
profile_1ms.d script to do so on OSX via dtrace.
using DTrace script
# In Terminal A
➝  sudo profile_1ms.d -c 'node --perf-basic-prof example/fibonacci' | \
      cpuprofilify > /tmp/example.cpuprofile
pid <process-pid>
HTTP server listening on port 8000

# In Terminal B
➝  ab -n 6 -c 2 http://:::8000/1000/
This is ApacheBench, Version 2.3 <$Revision: 1554214 $>
Copyright 1996 Adam Twiss, Zeus Technology Ltd, http://www.zeustech.net/
Licensed to The Apache Software Foundation, http://www.apache.org/

Benchmarking :: (be patient).....done
[ .. ]

➝  sudo kill <process-pid>
Now open /tmp/example.cpuprofile in Chrome DevTools Profiles - Load
NOTE: in order to try the above example please clone this repository.
cat trace.txt | cpuprofilify <options> > my.cpuprofile

  Converts the given trace taking according to the given opttions


OPTIONS:

--unresolveds  , --nounresolveds    unresolved addresses like `0x1a23c` are filtered from the trace unless this flag is set (default: false)
--sysinternals , --nosysinternals   sysinternals like `__lib_c_start...` are filtered from the trace unless this flag is set (default: false)
--v8internals  , --nov8internals    v8internals like `v8::internal::...` are filtered from the trace unless this flag is set (default: false)
--v8gc         , --nov8gc           when v8internals are filtered, garbage collection info is as well unless this flag set  (default: true)

--shortStack      , --noshortStack        stacks that have only one line are ignored unless this flag is set (default: false)
--optimizationinfo, --nooptimizationinfo  JS optimization info is removed unless this flag is set (default: false)


--type                              type of input `perf|dtrace`. If not supplied it will be detected.
--help                              print this help

EXAMPLE:

  Generate cpuprofile from DTrace data with default options
  using higher switchrate in order to deal with large amount of data being emitted

    sudo profile_1ms.d -x switchrate=1000hz  -c <command> | cpuprofilify > out.cpuprofile

  Generate cpuprofile from DTrace data with default options keeping v8 internals

    sudo profile_1ms.d -c <command> | cpuprofilify --v8internals > out.cpuprofile

  Generate cpuprofile from DTrace data with default options filtering v8 gc events

    sudo profile_1ms.d -c <command> | cpuprofilify --nov8gc > out.cpuprofile
perfuse this on any system that doesn't have DTrace, but perf instead like Linux
perf record -e cycles:u -g -- node --perf-basic-prof myapp.js
perf script | cpuprofilify > out.cpuprofile
Creates new CpuProfilifier
Converts the given trace taking according to the given opts.
var cpuprofilifier = require('cpuprofilifier');
var cpuprofile = cpuprofilifier().convert(trace);
fs.writeFileSync('/tmp/my.cpuprofile', JSON.stringify(cpuprofile));| Name | Type | Argument | Description | |||||||||||||||||||||||||||
|---|---|---|---|---|---|---|---|---|---|---|---|---|---|---|---|---|---|---|---|---|---|---|---|---|---|---|---|---|---|---|
trace | Array.<String> | a trace generated via | ||||||||||||||||||||||||||||
opts | Object |
<optional> |
Properties
|
an cpuprofile presentation of the given trace
generated with docme
MIT
FAQs
Converts output of various profiling/sampling tools to the .cpuprofile format so it can be loaded into Chrome DevTools.
We found that cpuprofilify demonstrated a not healthy version release cadence and project activity because the last version was released a year ago. It has 1 open source maintainer collaborating on the project.
Did you know?

Socket for GitHub automatically highlights issues in each pull request and monitors the health of all your open source dependencies. Discover the contents of your packages and block harmful activity before you install or update your dependencies.

Product
Socket Fix 2.0 brings targeted CVE remediation, smarter upgrade planning, and broader ecosystem support to help developers get to zero alerts.

Security News
Socket CEO Feross Aboukhadijeh joins Risky Business Weekly to unpack recent npm phishing attacks, their limited impact, and the risks if attackers get smarter.

Product
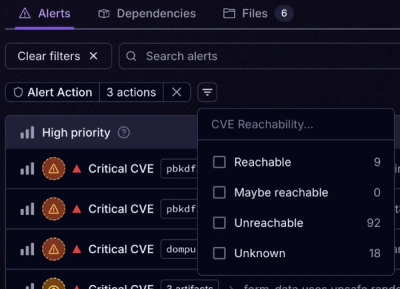
Socket’s new Tier 1 Reachability filters out up to 80% of irrelevant CVEs, so security teams can focus on the vulnerabilities that matter.