Product
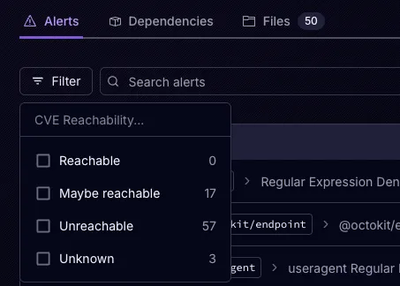
Announcing Precomputed Reachability Analysis in Socket
Socket’s precomputed reachability slashes false positives by flagging up to 80% of vulnerabilities as irrelevant, with no setup and instant results.
csv-chart-generator
Advanced tools
A tool for visualizing data from CSV files as line charts and converting the charts to a PDF document.
This project is a tool for visualizing data from CSV files as line charts and converting the charts to a PDF document. The CSV data is expected to contain one time column and three columns of numerical values representing the x, y, and z coordinates. The program reads the CSV data, generates line charts for each coordinate using the Chart.js library, and combines the charts into a single PDF document.
These instructions will get you a copy of the project up and running on your local machine for development and testing purposes.
To run this project, you will need to have Node.js and npm installed on your machine. You can check if you have these tools installed by running the following commands in the terminal:
node -v
npm -v
If you do not have Node.js and npm installed, you can download and install them from the official website (https://nodejs.org/).
To install the project, follow these steps:
git clone https://github.com/SeeknnDestroy/generate-line-chart-pdf.git
cd generate-line-chart-pdf
npm install
To use this project, follow these steps:
time,x,y,z
<miliseconds>,<numeric value>,<numeric value>,<numeric value>
<miliseconds>,<numeric value>,<numeric value>,<numeric value>
...
The first row should not contain the column names, rows should contain the data values. The time column should contain the time data in number of milliseconds since January 1, 1970. x, y, and z columns should contain numerical values. 2. In the index.js file, change the folderPath variable to the path of the folder containing your CSV files:
const folderPath = "path/to/folder";
node index.js
The PDF document will be saved to a file named output.pdf in the project root directory. The PDF will have as many pages as there are CSV files in the specified folder.
FAQs
A tool for visualizing data from CSV files as line charts and converting the charts to a PDF document.
The npm package csv-chart-generator receives a total of 0 weekly downloads. As such, csv-chart-generator popularity was classified as not popular.
We found that csv-chart-generator demonstrated a not healthy version release cadence and project activity because the last version was released a year ago. It has 1 open source maintainer collaborating on the project.
Did you know?

Socket for GitHub automatically highlights issues in each pull request and monitors the health of all your open source dependencies. Discover the contents of your packages and block harmful activity before you install or update your dependencies.

Product
Socket’s precomputed reachability slashes false positives by flagging up to 80% of vulnerabilities as irrelevant, with no setup and instant results.

Product
Socket is launching experimental protection for Chrome extensions, scanning for malware and risky permissions to prevent silent supply chain attacks.

Product
Add secure dependency scanning to Claude Desktop with Socket MCP, a one-click extension that keeps your coding conversations safe from malicious packages.