Product
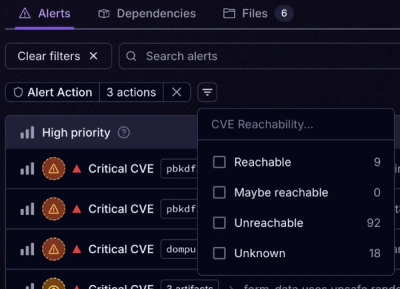
Introducing Tier 1 Reachability: Precision CVE Triage for Enterprise Teams
Socket’s new Tier 1 Reachability filters out up to 80% of irrelevant CVEs, so security teams can focus on the vulnerabilities that matter.
cypress-code-coverage
Advanced tools

Saves the code coverage collected during Cypress tests
npm install -D @cypress/code-coverage
Note: this plugin assumes cypress is a peer dependency already installed in your project.
Add to your cypress/support/index.js file
import '@cypress/code-coverage/support'
Register tasks in your cypress/plugins/index.js file
module.exports = (on, config) => {
  require('@cypress/code-coverage/task')(on, config)

  // add other tasks to be registered here

  // IMPORTANT to return the config object
  // with the any changed environment variables
  return config
}
This plugin DOES NOT instrument your code. You have to instrument it yourself using Istanbul.js tool. Luckily it is not difficult. For example, if you are already using Babel to transpile you can add babel-plugin-istanbul to your .babelrc and instrument on the fly.
{
  "plugins": ["istanbul"]
}
Please see the Examples section down below, you can probably find a linked project matching your situation to see how to instrument your application's source code before running end-to-end tests to get the code coverage.
If your application has been instrumented correctly, then you should see additional counters and instructions in the application's JavaScript resources, like the image down below shows.

You should see the window.__coverage__ object in the "Application under test iframe"

If you have instrumented your application's code and see the window.__coverage__ object, then this plugin will save the coverage into .nyc_output folder and will generate reports after the tests finish (even in the interactive mode). Find the LCOV and HTML report in the coverage/lcov-report folder.

That should be it! You should see messages from this plugin in the Cypress Command Log

You need to instrument your web application. This means that when the test does cy.visit('localhost:3000') any code the index.html requests should be instrumented by YOU. See Examples section for advice, usually you need to stick babel-plugin-istanbul into your pipeline somewhere.
If you are testing individual functions from your application code by importing them directly into Cypress spec files, this is called "unit tests" and Cypress can instrument this scenario for you. See Instrument unit tests section.
The coverage folder has results in several formats, and the coverage raw data is stored in .nyc_output folder. You can see the coverage numbers yourself. This plugin has nyc as a dependency, so it should be available right away. Here are common examples:
# see just the coverage summary
$ npx nyc report --reporter=text-summary
# see just the coverage file by file
$ npx nyc report --reporter=text
# save the HTML report again
$ npx nyc report --reporter=lcov
It is useful to enforce minimum coverage numbers. For example:
$ npx nyc report --check-coverage --lines 80
----------|---------|----------|---------|---------|-------------------
File      | % Stmts | % Branch | % Funcs | % Lines | Uncovered Line #s
----------|---------|----------|---------|---------|-------------------
All files |     100 |      100 |     100 |     100 |
 main.js  |     100 |      100 |     100 |     100 |
----------|---------|----------|---------|---------|-------------------

$ npx nyc report --check-coverage --lines 101
----------|---------|----------|---------|---------|-------------------
File      | % Stmts | % Branch | % Funcs | % Lines | Uncovered Line #s
----------|---------|----------|---------|---------|-------------------
All files |     100 |      100 |     100 |     100 |
 main.js  |     100 |      100 |     100 |     100 |
----------|---------|----------|---------|---------|-------------------
ERROR: Coverage for lines (100%) does not meet global threshold (101%)
Watch video How to read code coverage report to see how to read the HTML coverage report.
If you test your application code directly from specs you might want to instrument them and combine unit test code coverage with any end-to-end code coverage (from iframe). You can easily instrument spec files using babel-plugin-istanbul for example.
Install the plugin
npm i -D babel-plugin-istanbul
Set your .babelrc file
{
  "plugins": ["istanbul"]
}
Put the following in cypress/plugins/index.js file to use .babelrc file
module.exports = (on, config) => {
  require('@cypress/code-coverage/task')(on, config)
  on('file:preprocessor', require('@cypress/code-coverage/use-babelrc'))
  return config
}
Now the code coverage from spec files will be combined with end-to-end coverage.
Find example of a just the unit tests and JavaScript source files with collected code coverage in examples/unit-tests-js.
If you cannot use .babelrc for some reason (maybe it is used by other tools?), try using the Browserify transformer included with this module in use-browserify-istanbul file.
module.exports = (on, config) => {
  require('@cypress/code-coverage/task')(on, config)
  on(
    'file:preprocessor',
    require('@cypress/code-coverage/use-browserify-istanbul')
  )
  return config
}
Example in examples/backend folder.
You can also instrument your server-side code and produce combined coverage report that covers both the backend and frontend code
node src/server then to run instrumented version you can do nyc --silent node src/server.const express = require('express')
const app = express()
require('@cypress/code-coverage/middleware/express')(app)
Tip: you can register the endpoint only if there is global code coverage object, and you can exclude the middleware code from the coverage numbers
// https://github.com/gotwarlost/istanbul/blob/master/ignoring-code-for-coverage.md
/* istanbul ignore next */
if (global.__coverage__) {
  require('@cypress/code-coverage/middleware/express')(app)
}
If you use Hapi server, define the endpoint yourself and return the object
if (global.__coverage__) {
  require('@cypress/code-coverage/middleware/hapi')(server)
}
For any other server, define the endpoint yourself and return the coverage object:
if (global.__coverage__) {
  // add method "GET /__coverage__" and response with JSON
  onRequest = (response) => response.sendJSON({ coverage: global.__coverage__ })
}
cypress.json file to let the plugin know where to call to receive the code coverage data from the server. Place it in env.codeCoverage object:{
"env": {
"codeCoverage": {
"url": "http://localhost:3000/__coverage__"
}
}
}
That should be enough - the code coverage from the server will be requested at the end of the test run and merged with the client-side code coverage, producing a combined report.
If there is NO frontend code coverage, and you want to only collect the backend code coverage using Cypress tests, set expectBackendCoverageOnly: true in cypress.json file. Otherwise Cypress complains that it cannot find the frontend code coverage.
Default:

After:
{
  "env": {
    "codeCoverage": {
      "url": "http://localhost:3003/__coverage__",
      "expectBackendCoverageOnly": true
    }
  }
}

You can specify custom report folder by adding nyc object to the package.json file. For example to save reports to cypress-coverage folder, use:
{
  "nyc": {
    "report-dir": "cypress-coverage"
  }
}
You can specify custom coverage reporter(s) to use. For example to output text summary and save JSON report in cypress-coverage folder set in your package.json folder:
{
  "nyc": {
    "report-dir": "cypress-coverage",
    "reporter": ["text", "json"]
  }
}
Tip: find list of reporters here
Sometimes NYC tool might be installed in a different folder not in the current or parent folder, or you might want to customize the report command. In that case, put the custom command into package.json in the current folder and this plugin will automatically use it.
{
  "scripts": {
    "coverage:report": "call NYC report ..."
  }
}
TypeScript source files should be automatically included in the report, if they are instrumented.
See examples/ts-example, bahmutov/cra-ts-code-coverage-example or bahmutov/cypress-angular-coverage-example.
By default, the code coverage report includes only the instrumented files loaded by the application during the tests. If some modules are loaded dynamically, or are loaded by the pages NOT visited during any tests, these files are not going to be in the report - because the plugin does not know about them. You can include all expected source files in the report by using include list in the package.json file. The files without counters will have 0 percent code coverage.
For example, if you want to make sure the final report includes all JS files from the "src/pages" folder, set the "nyc" object in your package.json file.
{
  "nyc": {
    "all": true,
    "include": "src/pages/*.js"
  }
}
See example examples/all-files
You can exclude parts of the code or entire files from the code coverage report. See Istanbul guide. Common cases:
When running code only during Cypress tests, the "else" branch will never be hit. Thus we should exclude it from the branch coverage computation:
// expose "store" reference during tests
/* istanbul ignore else */
if (window.Cypress) {
  window.store = store
}
Often needed to skip a statement
/* istanbul ignore next */
if (global.__coverage__) {
  require('@cypress/code-coverage/middleware/express')(app)
}
Or a particular switch case
switch (foo) {
  case 1 /* some code */:
    break
  /* istanbul ignore next */
  case 2: // really difficult to hit from tests
    someCode()
}
See nyc configuration and include and exclude options. You can include and exclude files using minimatch patterns in .nycrc file or using "nyc" object inside your package.json file.
For example, if you want to only include files in the app folder, but exclude app/util.js file, you can set in your package.json
{
  "nyc": {
    "include": ["app/**/*.js"],
    "exclude": ["app/util.js"]
  }
}
Note: if you have all: true NYC option set, this plugin will check the produced .nyc_output/out.json before generating the final report. If the out.json file does not have information for some files that should be there according to include list, then an empty placeholder will be included, see PR 208.
Another important option is excludeAfterRemap. By default it is false, which might let excluded files through. If you are excluding the files, and the instrumenter does not respect the nyc.exclude setting, then add excludeAfterRemap: true to tell nyc report to exclude files. See examples/exclude-files.
You can skip the client-side code coverage hooks by setting the environment variable coverage to false.
# tell Cypress to set environment variable "coverage" to false
cypress run --env coverage=false
# or pass the environment variable
CYPRESS_coverage=false cypress run
or set it to false in the cypress.json file
{
  "env": {
    "coverage": false
  }
}
See Cypress environment variables and support.js. You can try running without code coverage in this project yourself
# run with code coverage
npm run dev
# disable code coverage
npm run dev:no:coverage
Full examples we use for testing in this repository:
cy.visit is made once in the before hookcy.visit before each testLook up the list of examples under GitHub topic cypress-code-coverage-example
babel-plugin-istanbul during tests.react-scripts.react-scripts by using @cypress/instrument-cra.app folder using nyc instrument as a separate step before running E2E testsChange the plugins file cypress/plugins/index.js
// BEFORE
module.exports = (on, config) => {
  on('task', require('@cypress/code-coverage/task'))
}
// AFTER
module.exports = (on, config) => {
  require('@cypress/code-coverage/task')(on, config)
  // IMPORTANT to return the config object
  // with the any changed environment variables
  return config
}
Tip: we include plugins.js file you can point at from your code in simple cases. From your cypress.json file:
{
  "pluginsFile": "node_modules/@cypress/code-coverage/plugins",
  "supportFile": "node_modules/@cypress/code-coverage/support"
}
See examples/use-plugins-and-support
This plugin uses debug module to output additional logging messages from its task.js file. This can help with debugging errors while saving code coverage or reporting. In order to see these messages, run Cypress from the terminal with environment variable DEBUG=code-coverage. Example using Unix syntax to set the variable:
$ DEBUG=code-coverage npm run dev
...
  code-coverage reset code coverage in interactive mode +0ms
  code-coverage wrote coverage file /code-coverage/.nyc_output/out.json +28ms
  code-coverage saving coverage report using command: "nyc report --report-dir ./coverage --reporter=lcov --reporter=clover --reporter=json" +3ms
Deeply nested object will sometimes have [object Object] values printed. You can print these nested objects by specifying a deeper depth by adding DEBUG_DEPTH= setting
$ DEBUG_DEPTH=10 DEBUG=code-coverage npm run dev
Common issue: not instrumenting your application when running Cypress.
If the plugin worked before in version X, but stopped after upgrading to version Y, please try the released versions between X and Y to see where the breaking change was.
If you decide to open an issue in this repository, please fill all information the issue template asks. The issues most likely to be resolved have debug logs, screenshots and hopefully public repository links so we can try running the tests ourselves.
You can test changes locally by running tests and confirming the code coverage has been calculated and saved.
npm run test:ci
# now check generated coverage numbers
npx nyc report --check-coverage true --lines 80
npx nyc report --check-coverage true --lines 100 --include cypress/about.js
npx nyc report --check-coverage true --lines 100 --include cypress/unit.js
Tip: use check-code-coverage for stricter code coverage checks than nyc report --check-coverage allows.
You can validate links in Markdown files in this directory by executing (Linux + Mac only) script
npm run check:markdown
This project is licensed under the terms of the MIT license.
FAQs
Saves the code coverage collected during Cypress tests
The npm package cypress-code-coverage receives a total of 65 weekly downloads. As such, cypress-code-coverage popularity was classified as not popular.
We found that cypress-code-coverage demonstrated a not healthy version release cadence and project activity because the last version was released a year ago. It has 1 open source maintainer collaborating on the project.
Did you know?

Socket for GitHub automatically highlights issues in each pull request and monitors the health of all your open source dependencies. Discover the contents of your packages and block harmful activity before you install or update your dependencies.

Product
Socket’s new Tier 1 Reachability filters out up to 80% of irrelevant CVEs, so security teams can focus on the vulnerabilities that matter.

Research
/Security News
Ongoing npm supply chain attack spreads to DuckDB: multiple packages compromised with the same wallet-drainer malware.

Security News
The MCP Steering Committee has launched the official MCP Registry in preview, a central hub for discovering and publishing MCP servers.