d3-geo-scale-bar
Like d3-axis but for maps, this module displays automatic scale bars for projected geospatial data.
Scale bars help viewers understand the geographic extent of maps. Printed maps, even those produced over a century ago, seldom lack them, yet scale bars are commonly missing from modern maps published on the internet. d3-geo-scale-bar makes it easy to add scale bars to maps created with d3-geo.
See it in action.
Installing
If you use NPM, npm install d3-geo-scale-bar. Otherwise, download the latest release. AMD, CommonJS, and vanilla environments are supported. In vanilla, a d3 global is exported:
<script src="https://unpkg.com/d3-geo-scale-bar@0.1.4/build/d3-geo-scale-bar.min.js"></script>
<script>

var scaleBar = d3.geoScaleBar()
  .projection(d3GeoProjection)
  .fitSize([width, height], geoJsonObject);

d3.select("svg").append("g").call(scaleBar);

</script>
Try d3-geo-scale-bar in your browser.
API Reference
A scale bar's default design references the classic checkered design:
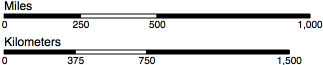
A scale bar consists of two g elements of classes "miles" and "kilometers". Each of those contains an axis with path elements of class "domain", g elements of class "tick" representing each of the scale's ticks, rect elements of alternating black and white fill, and finally a text element of class "label" containing the units of the corresponding scale bar. All of these can be styled and manipulated like normal SVG elements.
<g class="miles" transform="translate(0, 14)" font-size="10" font-family="sans-serif" text-anchor="middle">
  <path class="domain" stroke="#000" d="M0.5,4V0.5H218.62618117029396V4"></path>
  <g class="tick" opacity="1" transform="translate(0.5,0)">
    <line stroke="#000" y2="4"></line>
    <text fill="#000" y="7" dy="0.71em">
      0
    </text>
  </g>
  <g class="tick" opacity="1" transform="translate(55.03154529257349,0)">
    <line stroke="#000" y2="4"></line>
    <text fill="#000" y="7" dy="0.71em">
      250
    </text>
  </g>
  <g class="tick" opacity="1" transform="translate(109.56309058514698,0)">
    <line stroke="#000" y2="4"></line>
    <text fill="#000" y="7" dy="0.71em">
      500
    </text>
  </g>
  <g class="tick" opacity="1" transform="translate(218.62618117029396,0)">
    <line stroke="#000" y2="4"></line>
    <text fill="#000" y="7" dy="0.71em">
      1,000
    </text>
  </g>
  <rect height="4" x="0" width="50" style="stroke: #000; fill: #000;"></rect>
  <rect height="4" x="50" width="50" style="stroke: #000; fill: #fff;"></rect>
  <rect height="4" x="100" width="200" style="stroke: #000; fill: #000;"></rect>
  <text class="label" y="-4" style="fill: #000; text-anchor: start; font-size: 12px;">
    Miles
  </text>
</g>
# d3.geoScaleBar() <>
Constructs a new scale bar generator.
# scaleBar(context) <>
Render the scale bar to the given context, which may be either a selection of SVG containers (either SVG or G elements) or a corresponding transition. Configure the scale bar with scaleBar.projection and scaleBar.fitSize before rendering.
# scaleBar.projection([projection]) <>
If projection is specified, sets the projection and returns the scale bar. If projection is not specified, returns the current projection.
# scaleBar.fitSize(size, object) <>
A convenience method combining the setter functions of scaleBar.extent and scaleBar.feature. The following two statements are equivalent:
scaleBar.extent([width, height]).feature(object);
scaleBar.fitExtent([width, height], object);
# scaleBar.extent([size]) <>
If size is specified, sets the extent such that (1) the scale bar's default top-left corner aligns with the top-left corner of the projected geospatial data, and (2) you can position the scale bar vertically with scaleBar.top and horizontally with scaleBar.left. If size is not specified, returns the current extent.
# scaleBar.feature([object]) <>
If object< is specified, passes the corresponding GeoJSON Feature or FeatureCollection to the scale bar to allow for calculation of mile and kilometer scales and for positioning of the scale bar on the projected geospatial data. If object is not specified, returns the current object.
# scaleBar.kilometers([kilometers]) <>
If kilometers is specifed, sets the number of kilometers of the scale bar. Defaults to the largest exponent of 10 that will fit on the map. If kilometers is not specified, returns the current number of kilometers of the scale bar.
# scaleBar.kilometersRadius([kilometers]) <>
If kilometers is specifed, sets the number of kilometers of the radius of the sphere on which the geospatial data is projected. Defaults to 6,371, the radius of the Earth. If kilometers is not specified, returns the current number of kilometers of the sphere's radius.
# scaleBar.kilometersTickValues([values]) <>
If a values array is specified, the specified values are used for ticks rather than using the scale bar’s automatic tick generator. Defaults to [0, kilometers / 4, kilometers / 2, kilometers]. If values is not specified, returns the current tick values.
# scaleBar.miles([miles]) <>
If miles is specified, sets the number of miles of the scale bar. Defaults to the largest exponent of 10 that will fit on the map. If miles is not specified, returns the current number of miles of the scale bar.
# scaleBar.milesRadius([miles]) <>
If miles is specified, sets the number of miles of the radius of the sphere on which the geospatial data is projected. Defaults to 3,959, the radius of the Earth. If miles is not specified, returns the current number of miles of the sphere's radius.
# scaleBar.milesTickValues([values]) <>
If a values array is specified, the specified values are used for ticks rather than using the scale bar’s automatic tick generator. Defaults to [0, miles / 4, miles / 2, miles]. If values is not specified, returns the current tick values.
# scaleBar.height([height]) <>
If height is specified, sets the height of the scale bar in pixels. Defaults to 4. If height is not specified, returns the current height of the scale bar.
# scaleBar.left([left]) <>
If left is specified, sets the left position to the specified value which must be in the range [0, 1], where 0 is the left-most side of the projected geospatial data and 1 is the right-most. If left is not specified, returns the current left position which defaults to 0.
# scaleBar.top([top]) <>
If top is specified, sets the top position to the specified value which must be in the range [0, 1], where 0 is the top-most side of the projected geospatial data and 1 is the bottom-most. If top is not specified, returns the current top position which defaults to 0.