d3-geo-scale-bar
Like d3-axis but for maps, this module displays automatic scale bars for projected geospatial data.
In cartography, scale bars help viewers understand the geographic extent of maps. Professional cartographers seldom omit them from published maps, yet scale bars are commonly missing from interactive maps published on the internet. d3-geo-scale-bar makes it easy to add scale bars to maps created with d3-geo.
Installing
If you use NPM, npm install d3-geo-scale-bar. Otherwise, download the latest release. AMD, CommonJS, and vanilla environments are supported. In vanilla, a d3 global is exported:
<script src="https://unpkg.com/d3-geo-scale-bar@0.7.1/build/d3-geo-scale-bar.min.js"></script>
<script>

const projection = d3.geoMercator()
    .fitSize([width, height], geoJSON)

const scaleBar = d3.geoScaleBar()
    .projection(projection)
    .size([width, height]);

d3.select("svg")
    .attr("width", width)
    .attr("height", height)
  .append("g")
    .call(scaleBar);

</script>
Try d3-geo-scale-bar in your browser.
API Reference
Introduction
A scale bar's default design references the classic checkered design:
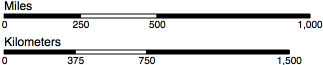
A scale bar consists of a g element which, by default, contains one path element of class "domain", four g elements of class "tick" representing each of the scale bar's ticks. Each tick has a line element to draw the tick line, a text element for the tick label, and a rect element of alternating black and white fill. There is also another text element of class "label" sitting above the bar that denotes the units. All of these can be styled and manipulated like normal SVG elements.
<g font-family="sans-serif" transform="translate(0,0)">
  <path class="domain" fill="none" stroke="currentColor" d="M0,4 L0,0 L200,0 L200,4"></path>
  <g class="tick" transform="translate(0)" opacity="1">
    <line stroke="currentColor" y2="4"></line>
    <text fill="currentColor" y="6" font-size="10" text-anchor="middle" dy="0.71em">0</text>
    <rect fill="currentColor" stroke="currentColor" stroke-width="0.5" width="50" height="4"></rect>
  </g>
  <g class="tick" transform="translate(50)" opacity="1">
    <line stroke="currentColor" y2="4"></line>
    <text fill="currentColor" y="6" font-size="10" text-anchor="middle" dy="0.71em">25</text>
    <rect fill="#fff" stroke="currentColor" stroke-width="0.5" width="50" height="4"></rect>
  </g>
  <g class="tick" transform="translate(100)" opacity="1">
    <line stroke="currentColor" y2="4"></line>
    <text fill="currentColor" y="6" font-size="10" text-anchor="middle" dy="0.71em">50</text>
    <rect fill="currentColor" stroke="currentColor" stroke-width="0.5" width="100" height="4"></rect>
  </g>
  <g class="tick" transform="translate(200)" opacity="1">
    <line stroke="currentColor" y2="4"></line>
    <text fill="currentColor" y="6" font-size="10" text-anchor="middle" dy="0.71em">100</text>
    <rect fill="#fff" stroke="currentColor" stroke-width="0.5" width="0" height="4"></rect>
  </g>
  <text class="label" fill="currentColor" font-size="12" dy="-0.32em" x="0" text-anchor="start">Kilometers</text>
</g>
# d3.geoScaleBar() · Source, Example
Constructs a new scale bar generator with the default settings.
# scaleBar(context) · Source, Example
Render the scale bar to the given context, which may be either a selection of SVG containers (either SVG or G elements) or a corresponding transition. Configure the scale bar with scaleBar.projection and scaleBar.extent before rendering. Generally, you will use this with selection.call:
const scaleBar = d3.geoScaleBar()
    .projection(projection)
    .size([width, height]);

svg.append("g").call(scaleBar);
Basic configuration
# scaleBar.extent([extent]) · Source, Example
If extent is specified, sets the extent of the scale bar generator to the specified bounds and returns the scale bar. The extent bounds are specified as an array [[x0, y0], [x1, y1]], where x0 is the left side of the extent, y0 is the top, x1 is the right and y1 is the bottom. If extent is not specified, returns the current extent which defaults to null. An extent is required to render a scale bar.
# scaleBar.projection([projection]) · Source, Example
If projection is specified, sets the projection and returns the scale bar. If projection is not specified, returns the current projection. A projection is required to render a scale bar.
# scaleBar.size([size]) · Source, Example
An alias for scaleBar.extent where the minimum x and y of the extent are ⟨0,0⟩. Equivalent to:
scaleBar.extent([[0, 0], size]);
Positioning
# scaleBar.left([left]) · Source, Example
If left is specified, sets the left position to the specified value which must be in the range [0, 1], where 0 is the left-most side of the scale bar's extent and 1 is the right-most, and returns the scale bar. If left is not specified, returns the current left position which defaults to 0.
# scaleBar.top([top]) · Source, Example
If top is specified, sets the top position to the specified value which must be in the range [0, 1], where 0 is the top-most side of the scale bar's extent and 1 is the bottom-most, and returns the scale bar. If top is not specified, returns the current top position which defaults to 0.
Sizing
# scaleBar.distance([distance]) · Source, Example
If distance is specifed, sets the maxiumum distance of the scale bar in the scale bar's units and returns the scale bar. Defaults to the largest exponent of 10 that will fit on the map. If distance is not specified, returns the current maximum distance of the scale bar.
# scaleBar.radius([radius]) · Source, Example
If radius is specifed, sets the radius of the sphere on which the geospatial data is projected and returns the scale bar. Defaults to 6371.0088, the mean radius of Earth in kilometers. If you set units to d3.geoScaleMiles, the radius will also update to 3958.7613, the mean radius of Earth in miles. You can set the radius to any number you like, useful for mapping planets other than Earth. If radius is not specified, returns the current radius.
# scaleBar.units([units]) · Source, Example
If units is specifed, sets the radius of the scale bar to the corresponding units and returns the scale bar. Defaults to d3.geoScaleKilometers, which sets the label to "Kilometers" and the radius to 6371.0088, the mean radius of Earth in kilometers. Note that the Earth's radius varies depending upon latitude, so if extremely high precision matters, you can perform your own calculation of the radius and pass the output to scaleBar.radius.
If units is not specified, returns a string representing the current unit, e.g. "kilometers". The capitalized version of this string will be used for the label if no label is specified.
# d3.geoScaleFeet() · Source
When passed to scaleBar.units, sets the radius to 20902259.664, the mean radius of Earth in feet. The label will be set to "Feet" if no label is specified.
# d3.geoScaleKilometers() · Source
When passed to scaleBar.units, sets the radius to 6371.0088, the mean radius of Earth in kilometers. The label will be set to "Kilometers" if no label is specified.
# d3.geoScaleMeters() · Source
When passed to scaleBar.units, sets the radius to 6371008.8, the mean radius of Earth in meters. The label will be set to "Meters" if no label is specified.
# d3.geoScaleMiles() · Source
When passed to scaleBar.units, sets the radius to 3958.7613, the mean radius of Earth in miles. The label will be set to "Miles" if no label is specified.
Styling
# scaleBar.label([label]) · Source, Example
If a label string is specified, updates the text in the scale bar's label to the specified string and returns the scale bar. Defaults to the capitalized unit, e.g. "Kilometers". If label is specified as null, removes the label. If label is not specified, returns the current label.
# scaleBar.labelAnchor([anchor]) · Source, Example
If an anchor string is specified, aligns the scale bar's label such that it is either at the "start" of the scale bar, the "middle" of the scale bar, or the "end" of the scale bar. Defaults to "start". If an anchor string is not specified, returns the current anchor.
# scaleBar.orient([orientation]) · Source, Example
If an orientation is specified, styles the bar according to the specified orientation and returns the scale bar. If an orientation is not specified, returns the current orientation as a string, either "top" or "bottom". Defaults to d3.geoScaleBottom.
# d3.geoScaleBottom() · Source
When passed to scaleBar.orient, orients the scale bar so that the label is on the top and the ticks are on bottom. This is the default orientation.
scaleBar.orient(d3.geoScaleBottom);
# d3.geoScaleTop() · Source
When passed to scaleBar.orient, orients the scale bar so that the label is on the bottom and the ticks are on top.
scaleBar.orient(d3.geoScaleTop);
# scaleBar.tickFormat([formatter]) · Source, Example
If a formatter function is specified, each tick is passed through the formatter before being displayed. Defaults to (d, i, e) => Math.round(d), where d is the tick number, i is the tick index, and e is an array of all tick data. If a formatter is not specified, returns the current formatter.
# scaleBar.tickSize([size]) · Source, Example
If size is specified, sets the vertical tick size of the scale bar in pixels and returns the scale bar. Defaults to 4. If size is not specified, returns the current tick size of the scale bar.
# scaleBar.tickValues([values]) · Source, Example
If a values array is specified, the specified values are used for ticks rather than using the scale bar’s automatic tick generator. Defaults to [0, kilometers / 4, kilometers / 2, kilometers]. Passing null removes the values from the scale bar. If values is not specified, returns the current tick values.
Zooming
# scaleBar.zoomFactor([k]) · Source, Example
If k is specified, zooms the scale bar by the k zoom factor. This will commonly be used in conjunction with d3-zoom:
const zoom = d3.zoom()
.on("zoom", _ => {
const t = d3.event.transform;
g.attr("transform", t);
scaleBar.zoomFactor(t.k);
scaleBarSelection.call(scaleBar);
});
svg.call(zoom);
If k is not specified, returns the current zoom factor.