

Security News
Deno Goes the Way of the Dinosaur
Cloudflare is acquiring Deno’s team, which will provide another year of bug fixes and security updates before ending support for the runtime.
By Sarah Gooding - Oct 16, 2026
dsh-context
Advanced tools
A DeepSeek Harness plugin for context insight and management, with context dashboard and context command, for understanding how the context is made of, and how it evolves.
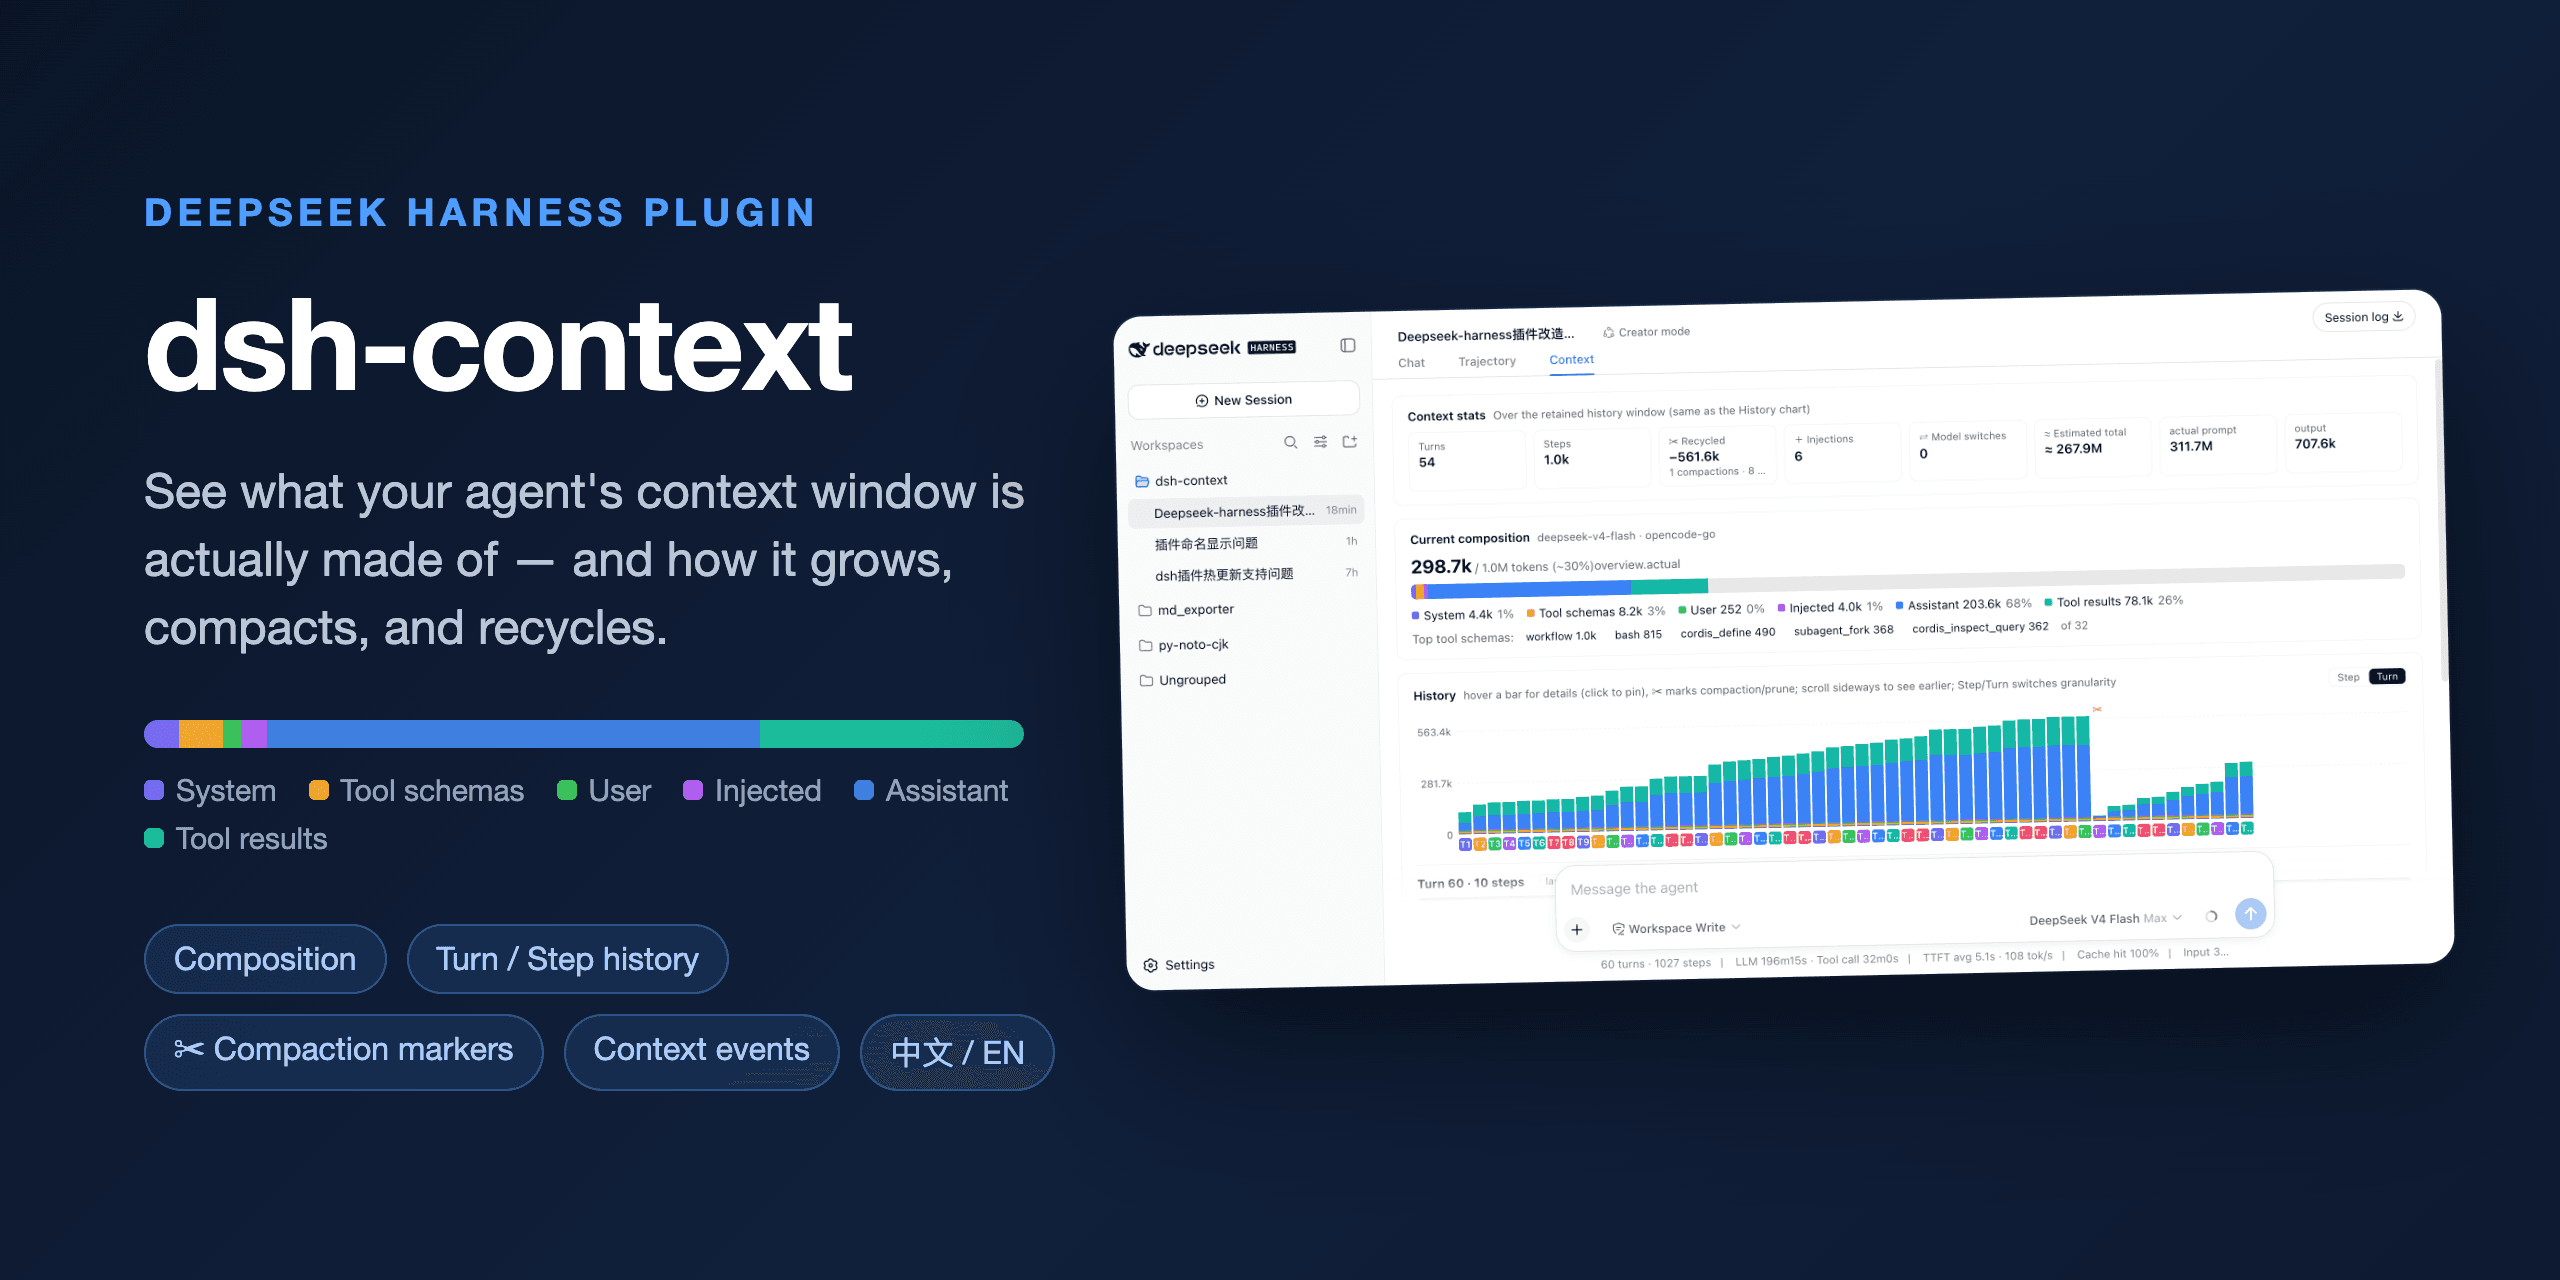


The best DeepSeek Harness plugin for Agent's context insights and management.
Recommended and starred by DeepSeek Harness staff @tianyicui and @turtle1999 — see this post on X.
dsh-context provides full context lifecycle management features.
/context command — the slash command shows the context model for current context composition and recent context evolution.Fill dsh-context in the Add plugin wizard's search box, and click Install:
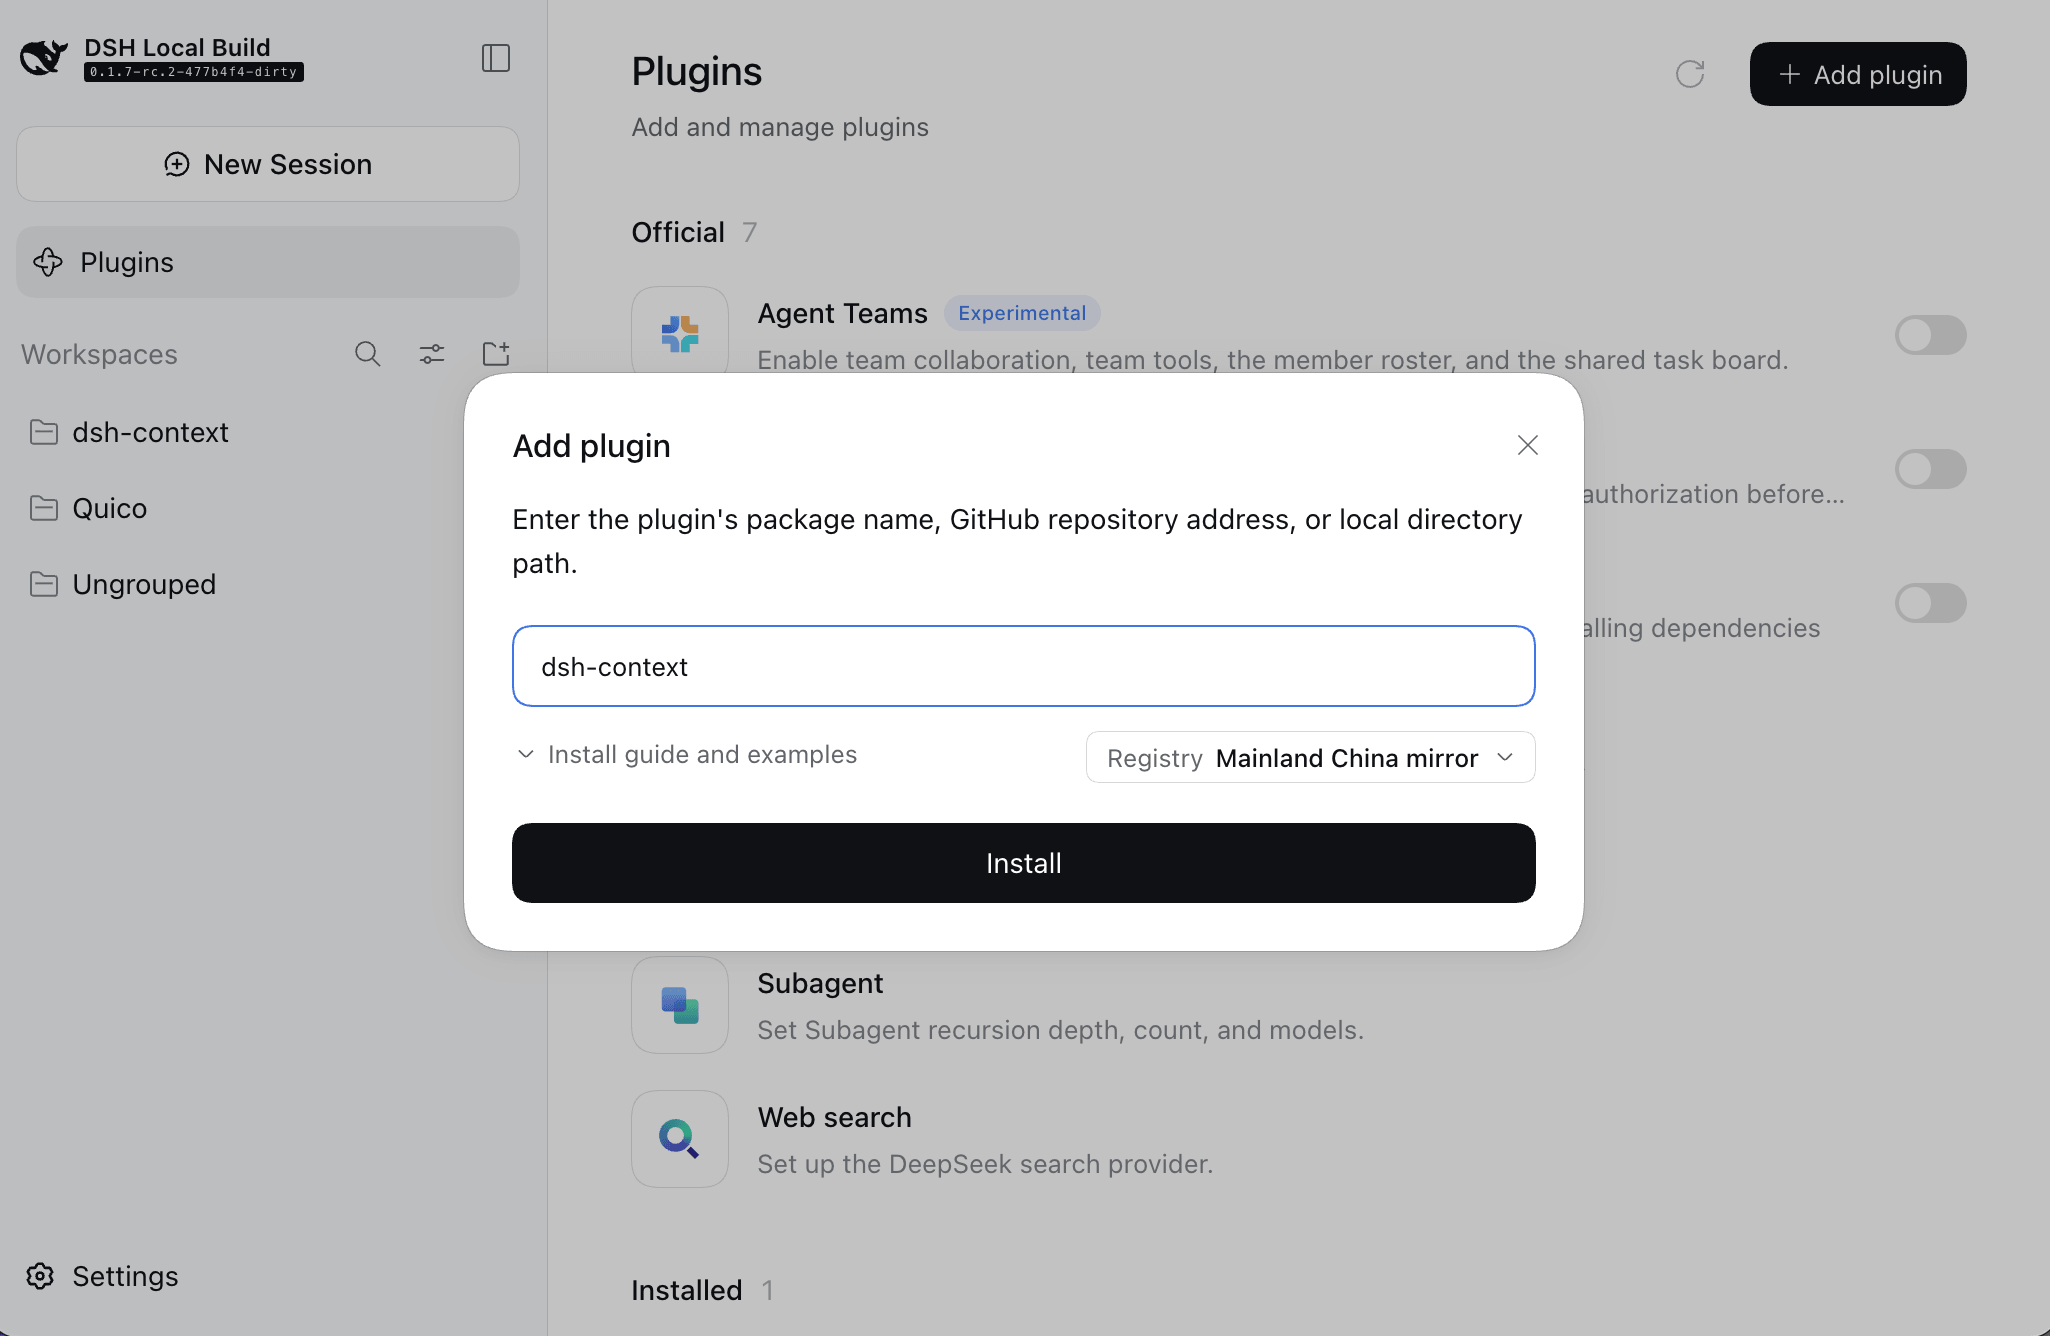
dsh cliInstall dsh-context plugin from DeepSeek Harness:
dsh plugin --profile web add dsh-context
Or update the dsh-context plugin:
dsh plugin --profile web update dsh-context@latest
Then start the web UI with dsh web. No build step, no restart.
Five surfaces, one story — what your agent is carrying, how it got there, and what it did with it:
| Where | What you get |
|---|---|
| Context Insights page | Every session at a glance: usage, cost, cache hit, daily activity, and per-session context profiles — filtered by range, day, group, or search, one click to jump in. |
| Context tab | The full dashboard: stats, composition, per-request trend, events, and file activity — in every session. |
| Fleet tab | The agent network: the current agent, its parents, and every subagent, live. |
/context command | A centered modal with the same composition and context browser, without leaving the chat. |
| Preferences card | Per-user defaults: view placement, trend granularity & mode, File Activity sort, and the system prompt prefix/suffix joined around every session. |
Click Context Insights / 上下文洞察 in the sidebar's panel list — the same row level as Plugins and Automation tasks — and the page opens as a full center-column panel:
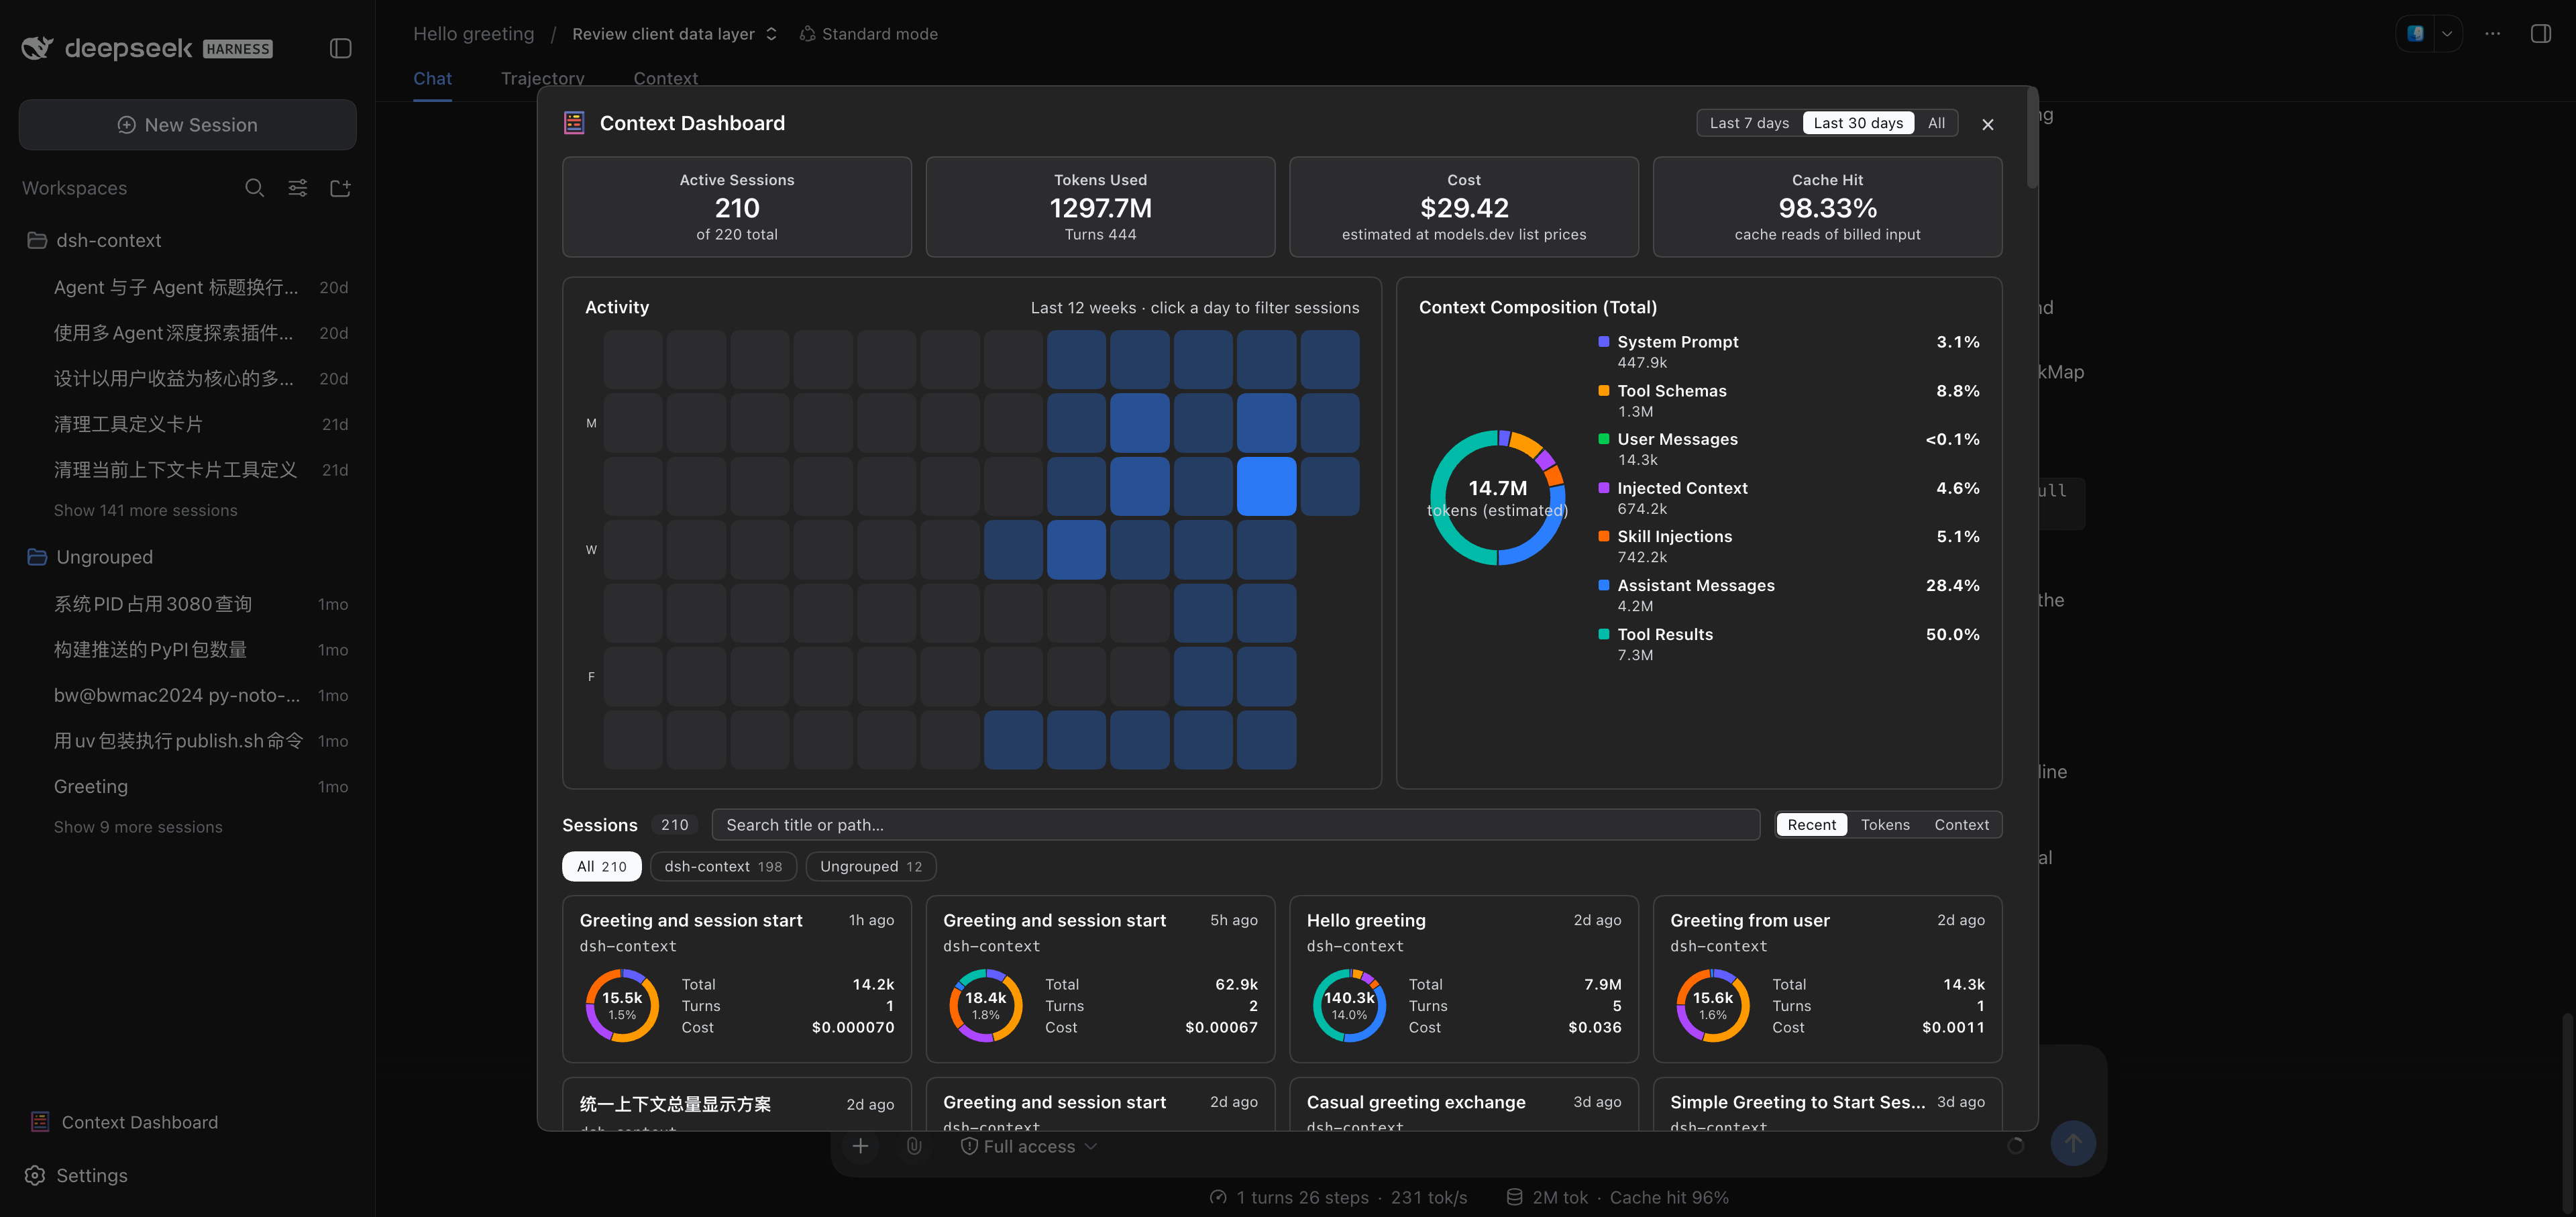
| Section | The question it answers |
|---|---|
| KPI band | How much am I using — sessions, billed tokens, estimated cost, and cache-hit rate over the picked range (7d / 30d / all). |
| 7-day usage chart | When did I spend what — each of the last 7 days' billed tokens and estimated cost as a bar pair, folded per turn off the sessions' own request times (not the session's last-active day). |
| Activity heatmap | When do I actually work — the last 8 weeks of daily billed tokens; click a day to filter the sessions that were active on it. |
| Settings entry | One row under the heatmap — the same guarded jump to this plugin's preferences as the Context tab's Plugin Info card. |
| Context Composition | Where the context windows went, summed over the range's sessions. |
| Session cards | Each session's profile: composition ring, billed tokens, turns, cost, and its workspace-group / project breadcrumb — sorted by recency, tokens, or context size, searchable, grouped by workspace. A card click opens the session. |
Open any session and click the Context / 上下文 tab:
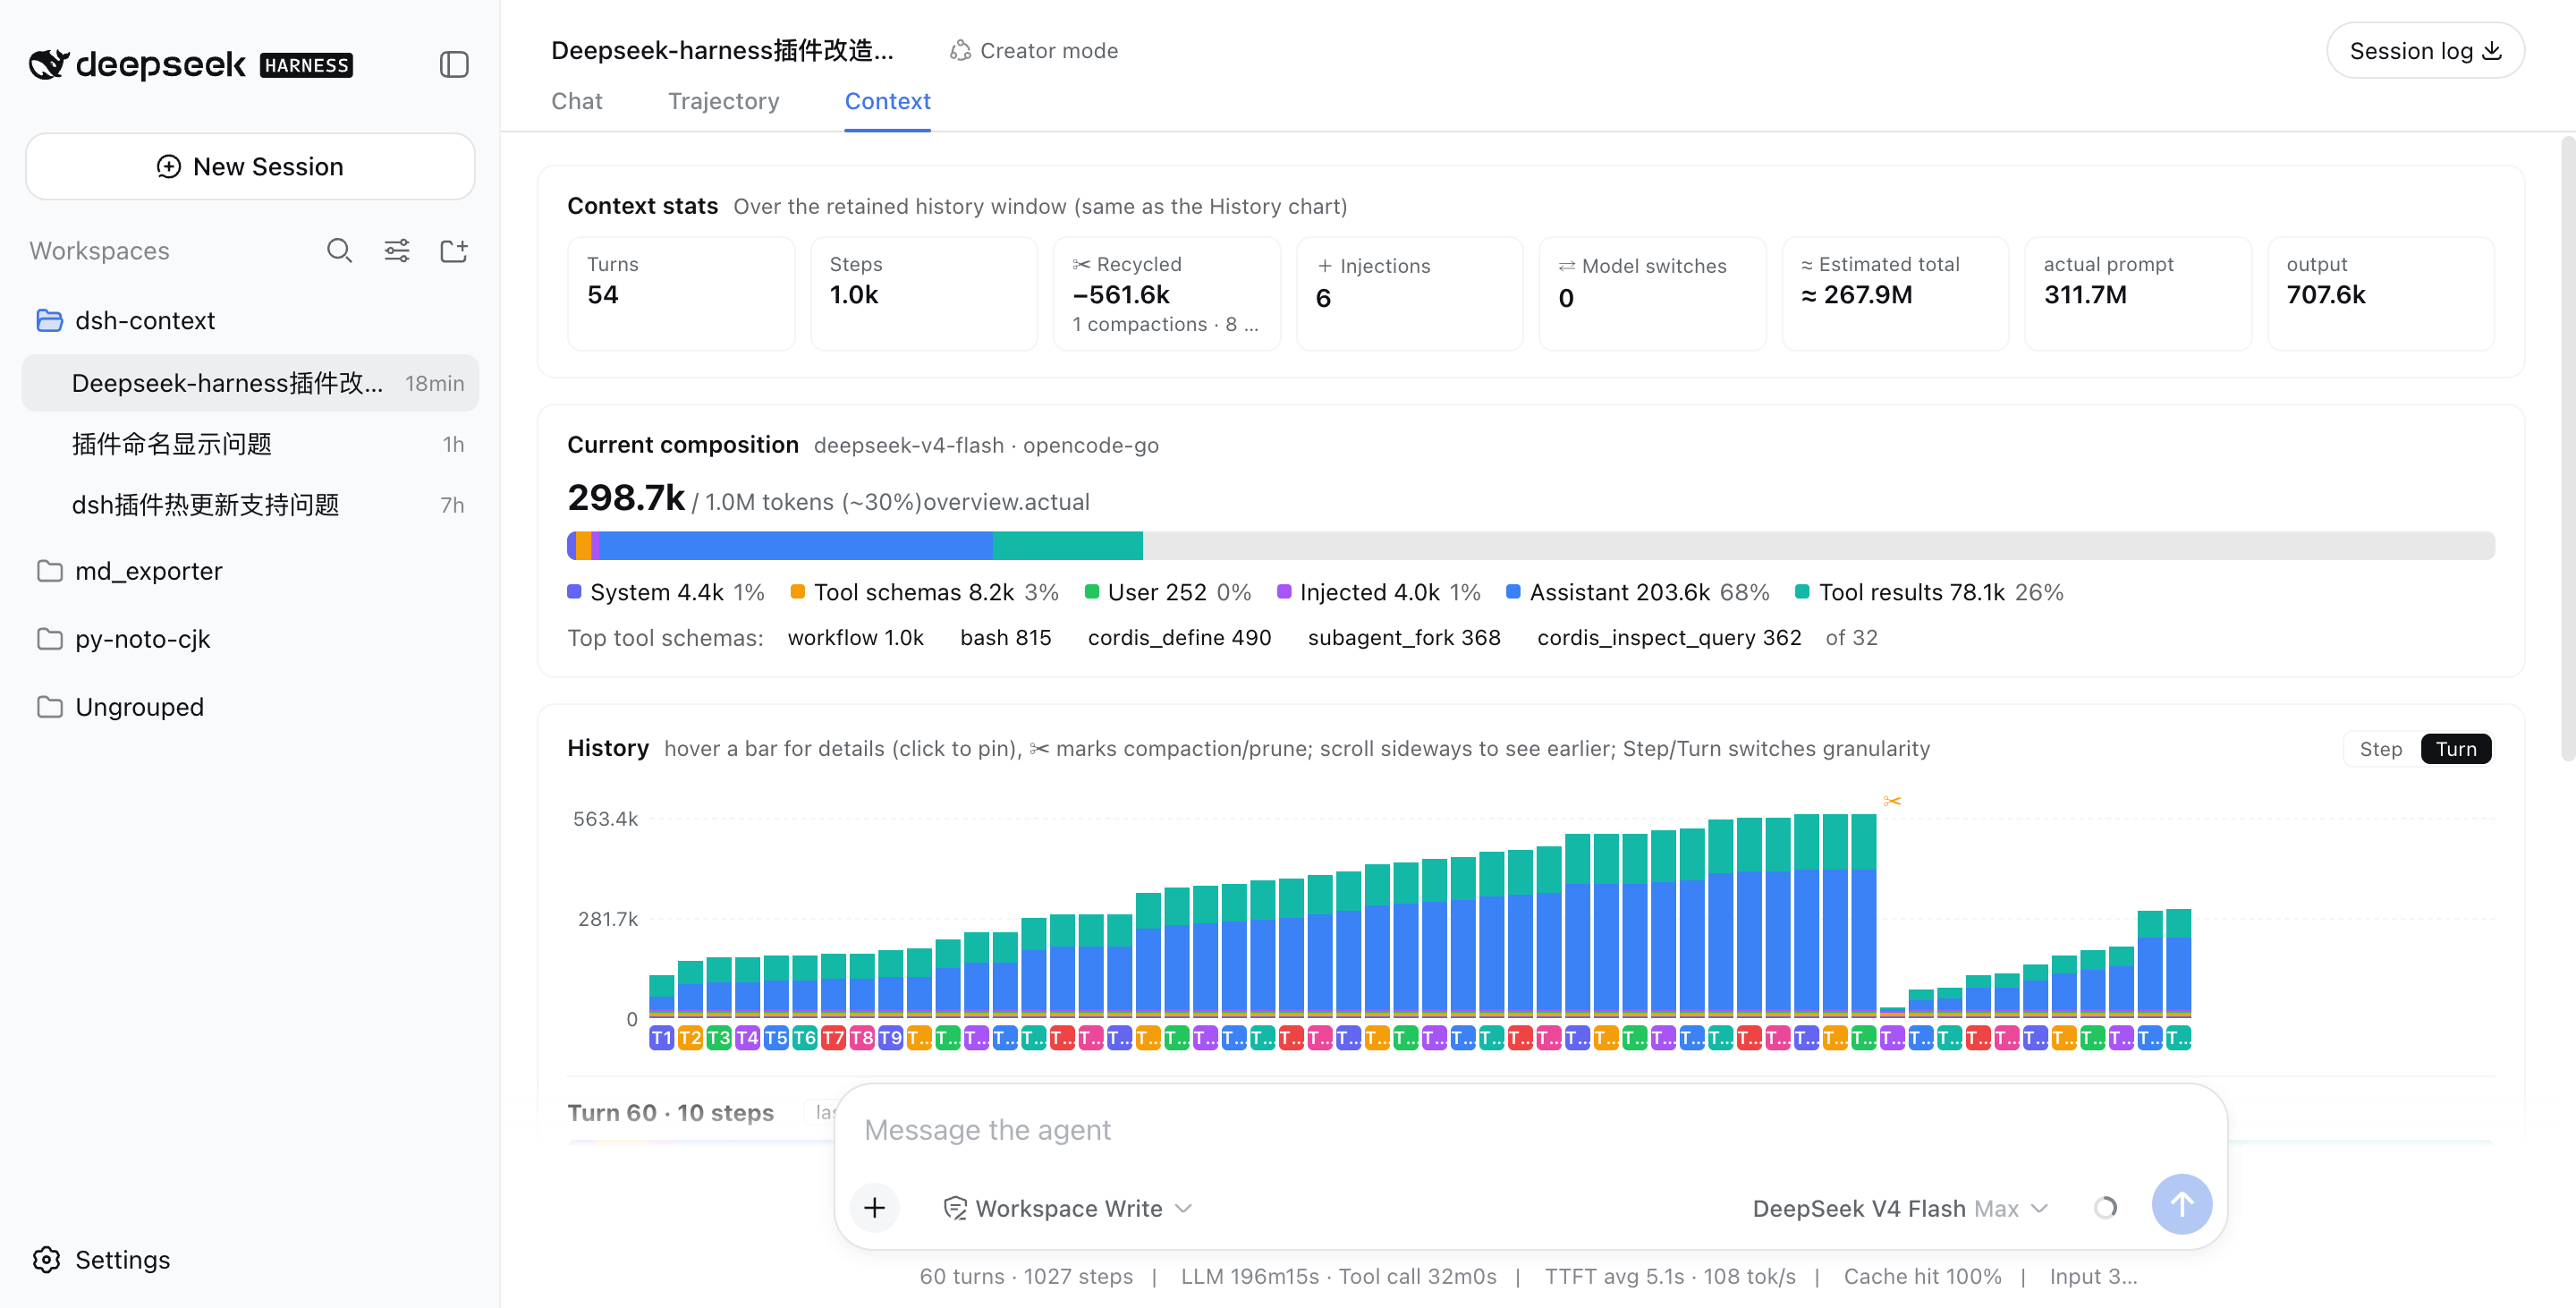
| Card | The question it answers |
|---|---|
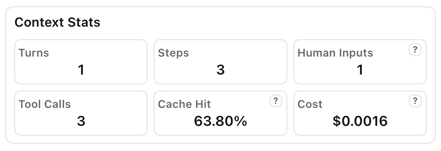
| Context Stats | Turns, steps, human inputs, live tool calls — plus a cost estimated from the models.dev list prices (hover the ? for per-1M rates; DeepSeek peak/off-peak aware). |
| Token Stats | Where the billed tokens went — the same total as the chat stats line under the composer, split by composition (system, tools, messages…) with the provider-exact output closing the ring, and the session's cache-hit rate in the corner. |
| Timing Stats | How active time split across model calls, tool runs, and overhead. |
| Current Context | What's in the window right now. |
| Context Trend | Every request's size — and its story. |
| Context Browser | What any request was actually assembled from. |
| Context Events | When and why the window changed. |
| File Activity | What the agent did to your files. |
The headline occupancy and composition read the same official token-meter projections as the chat composer's context ring (contextPressure / contextBreakdown), so the figures always match what the ring tells you — the card's percentage is that same occupancy, printed with one decimal.
The Context Stats card's Agent Network cell (the billed tokens and estimated cost of the whole family) jumps to the Fleet tab.


A six-color stacked bar against the model's full window (the two hatched masks at the end = auto-compaction's reserve: its headroom, then the request's reserved output window): system prompt, tool schemas, user messages, injected context, assistant replies, tool results — each with its ≈token figure and share. When a conversation starts degrading, this is where you see which part is responsible.
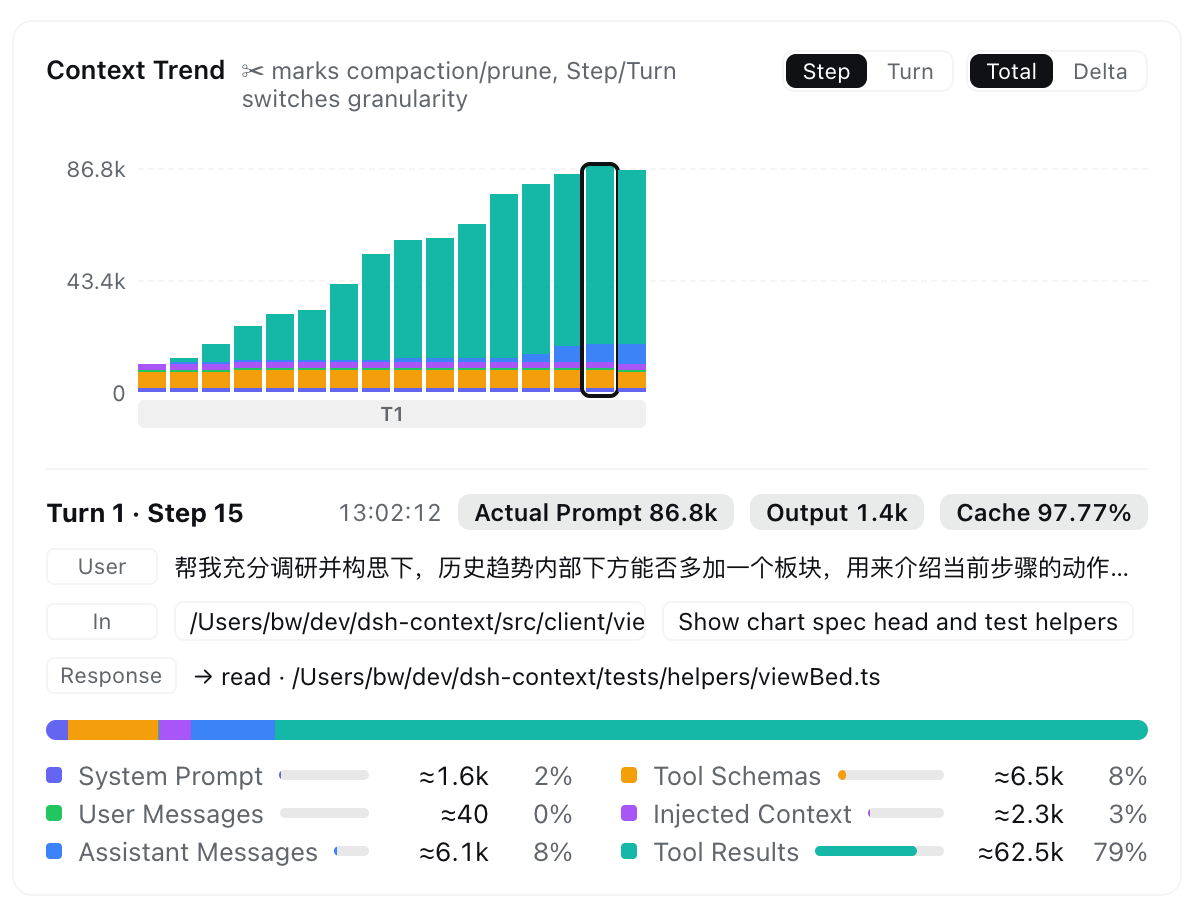
One stacked bar per model request — finer than per-message — so you watch the window grow turn by turn:
Pick Live (next request) or any retained step, and browse what that request was assembled from: seven collapsible categories expand into one row per element with its token price, and every element expands again into its actual content — the system prompt, each tool's JSON schema, message text, reasoning, tool arguments, and tool outputs. Skill content (the available-skills catalog, /skill invocations, and skill-tool loads) has its own Skill Injections category, so a stealthy skill's context footprint can't hide inside the injected-context and tool-result buckets.
tool-* first-party packages, dsh-* capability packages, mcp:<server> proxies, or the exact plugin watched live from tools.register(). Sort by size / name, and filter every category by its own searchable fields: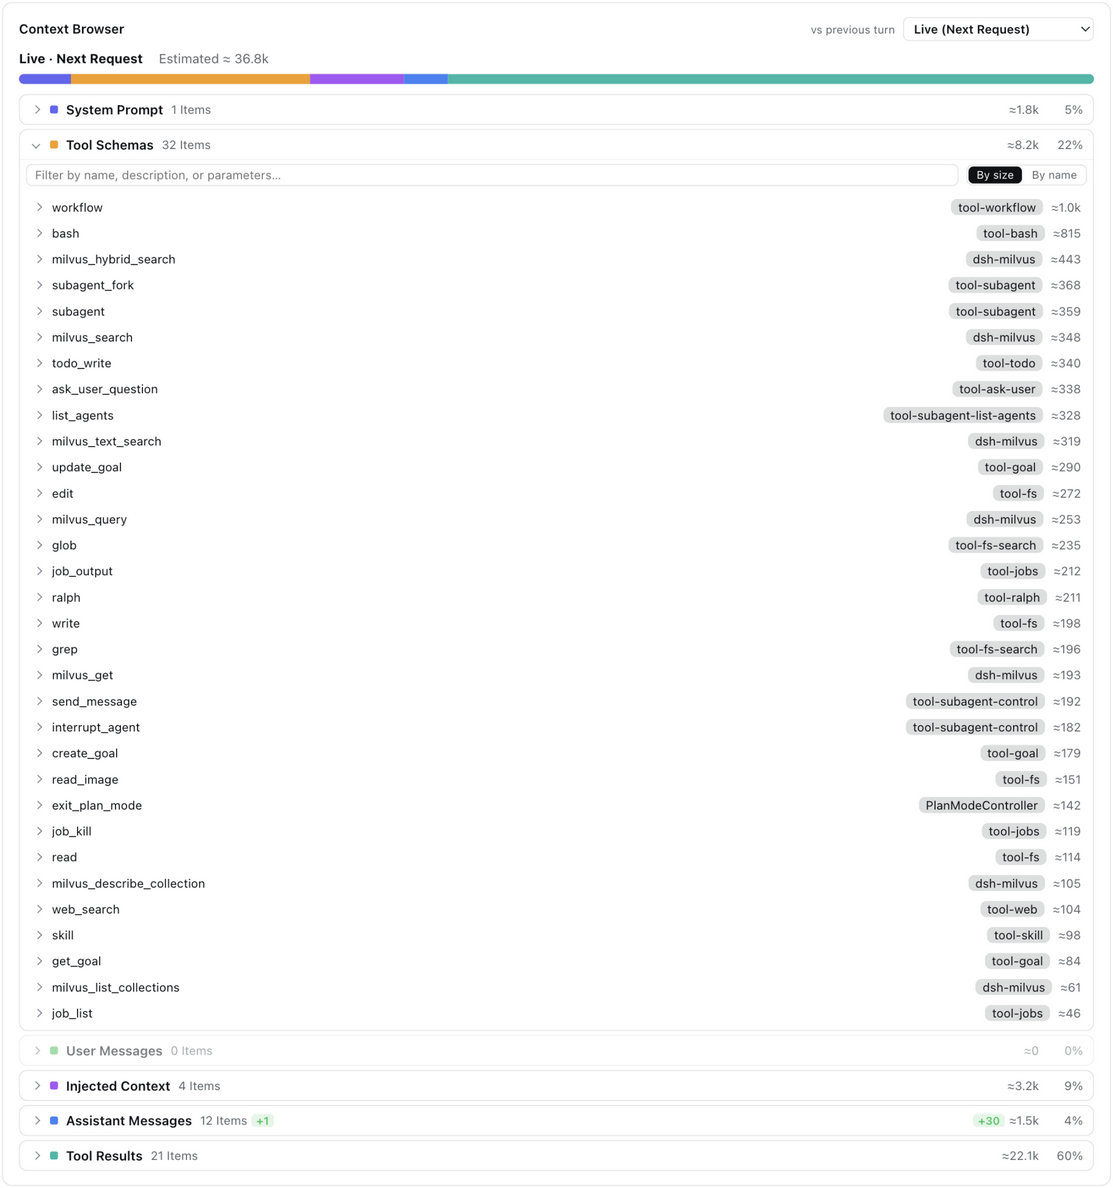
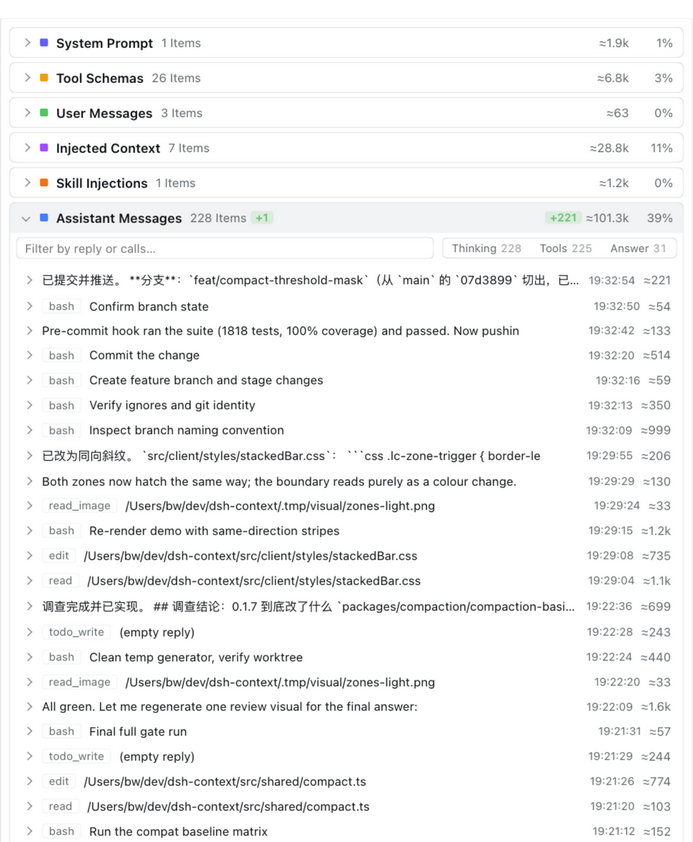
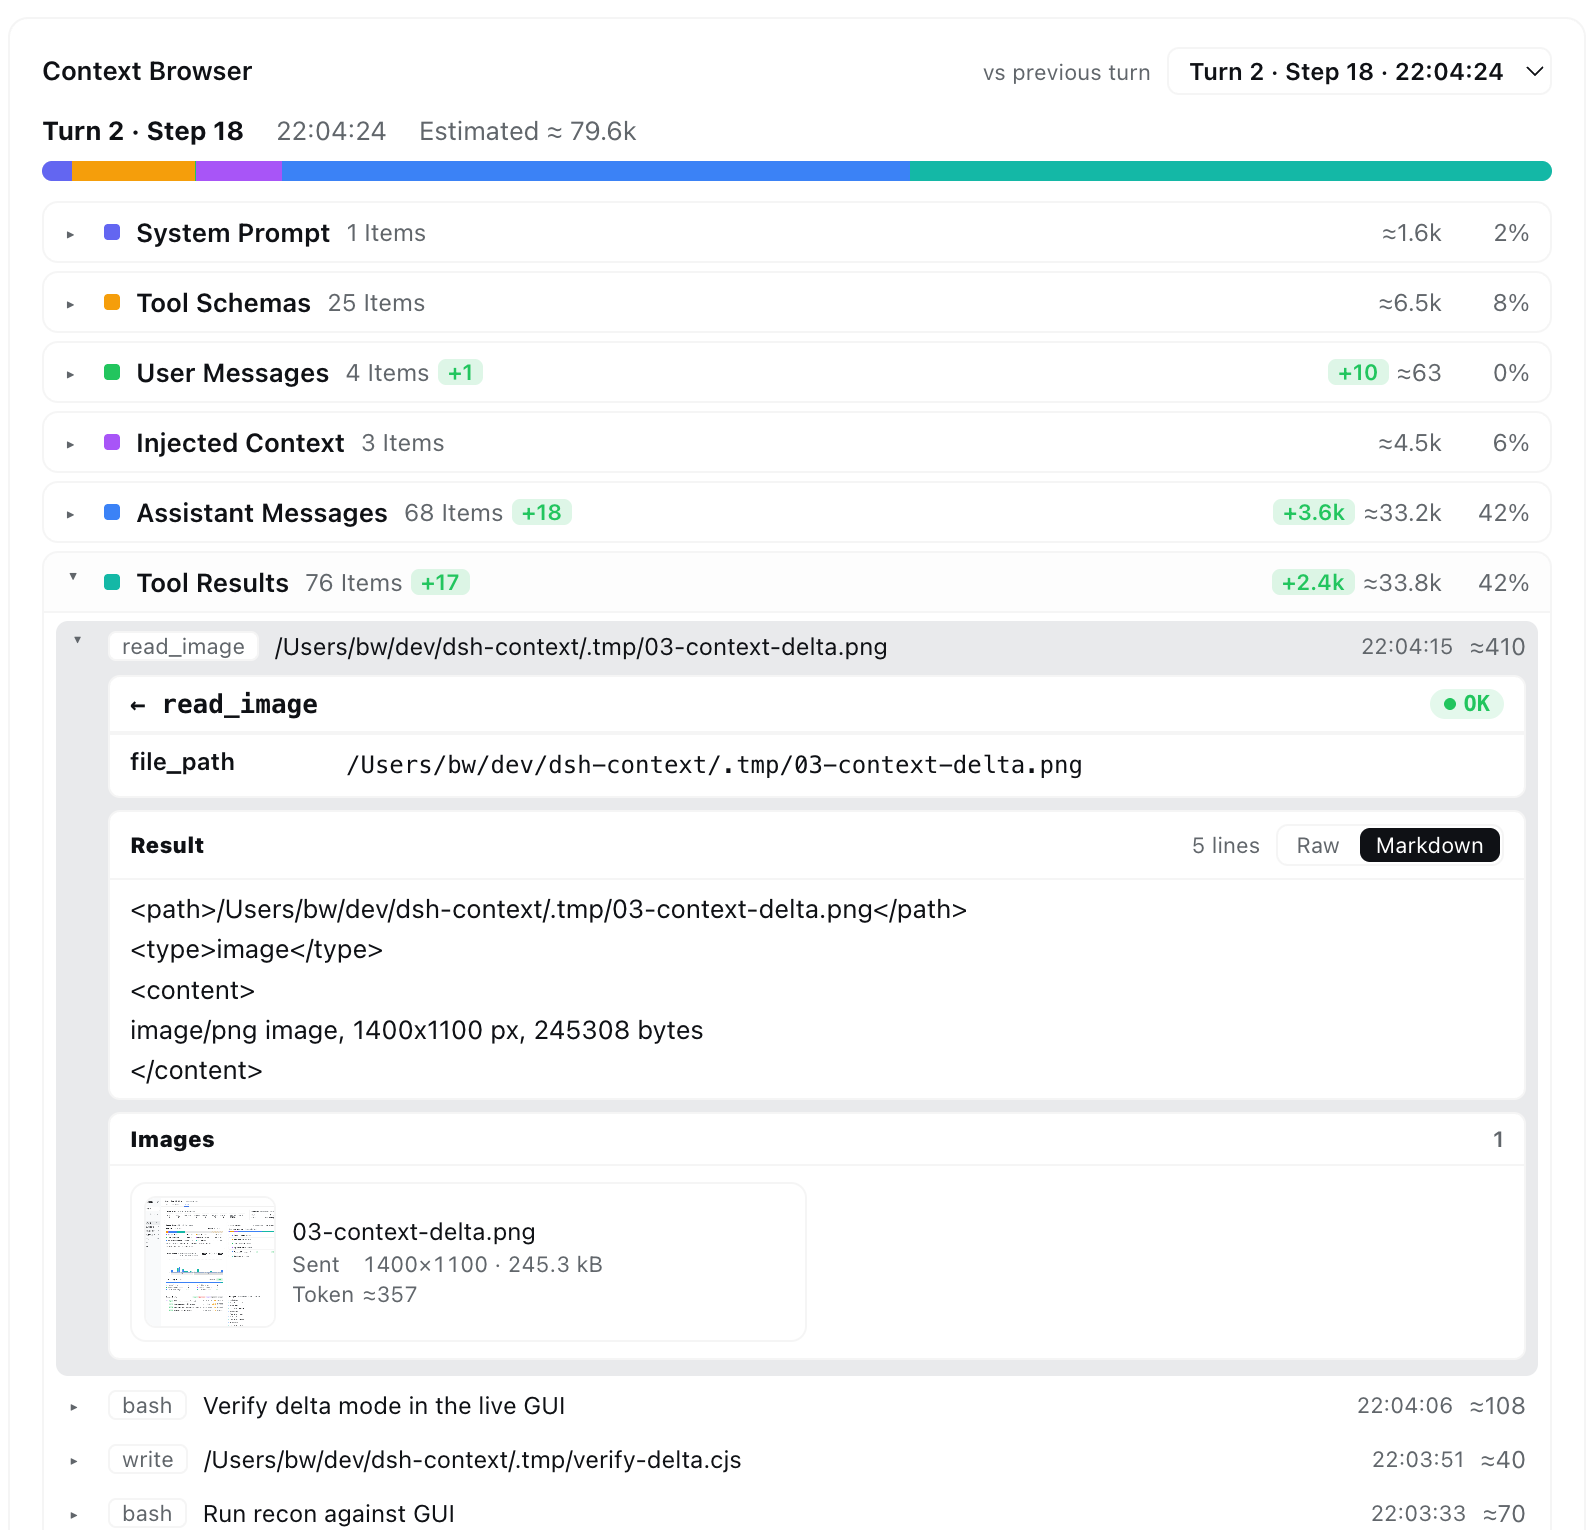
image and file blocks sit together in the order the message carries them, one card each: images with a thumbnail plus their dimensions, stored size, and the official DeepSeek image-token estimate; other files with their type glyph, extension, and stored size. One click opens the attachment in dsh's own preview column (markdown, code, PDF, office, and image viewers), under the file's real name: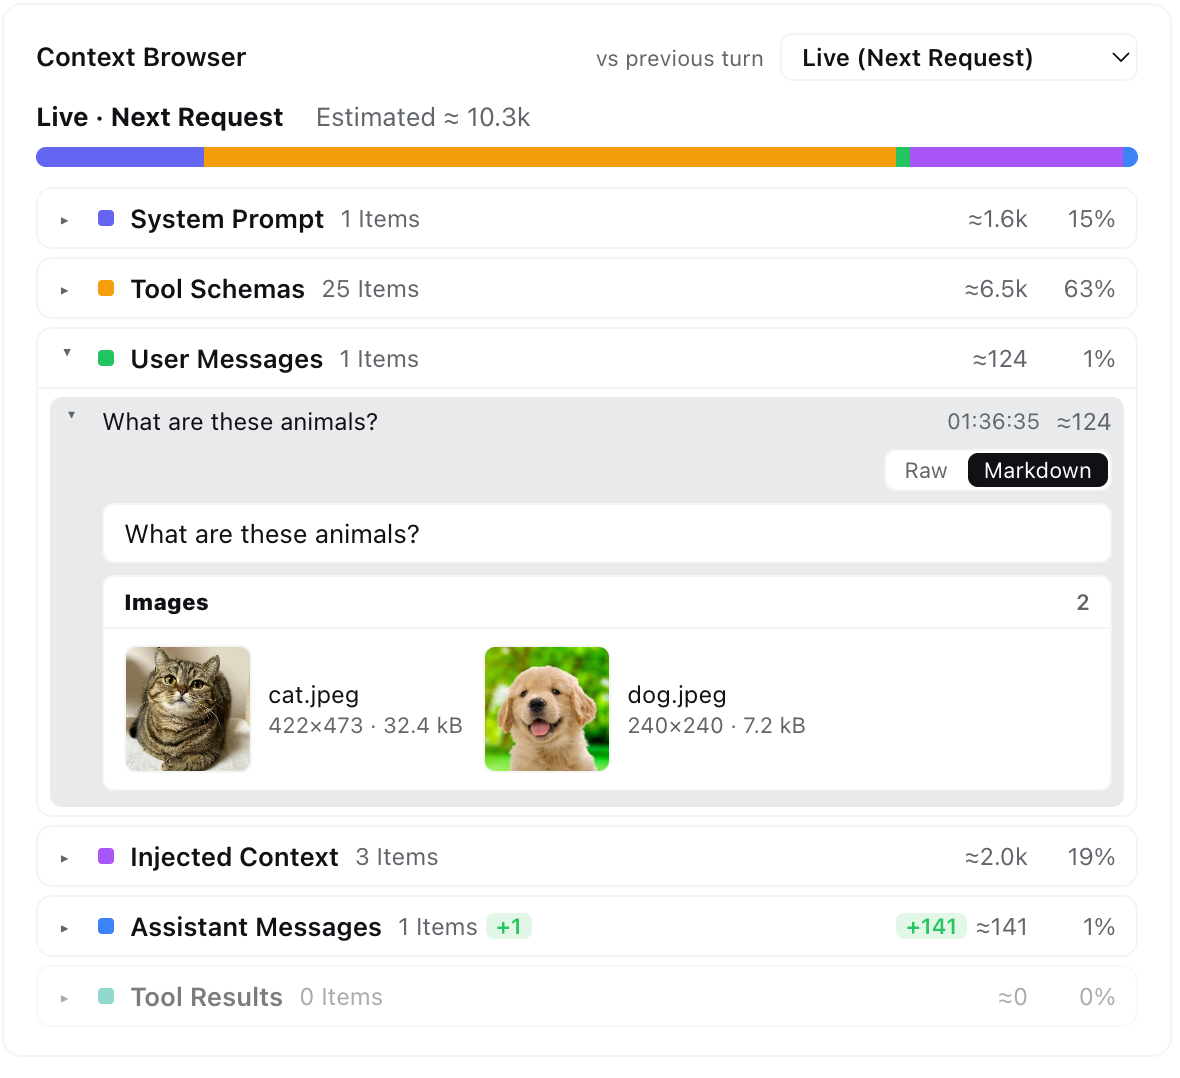
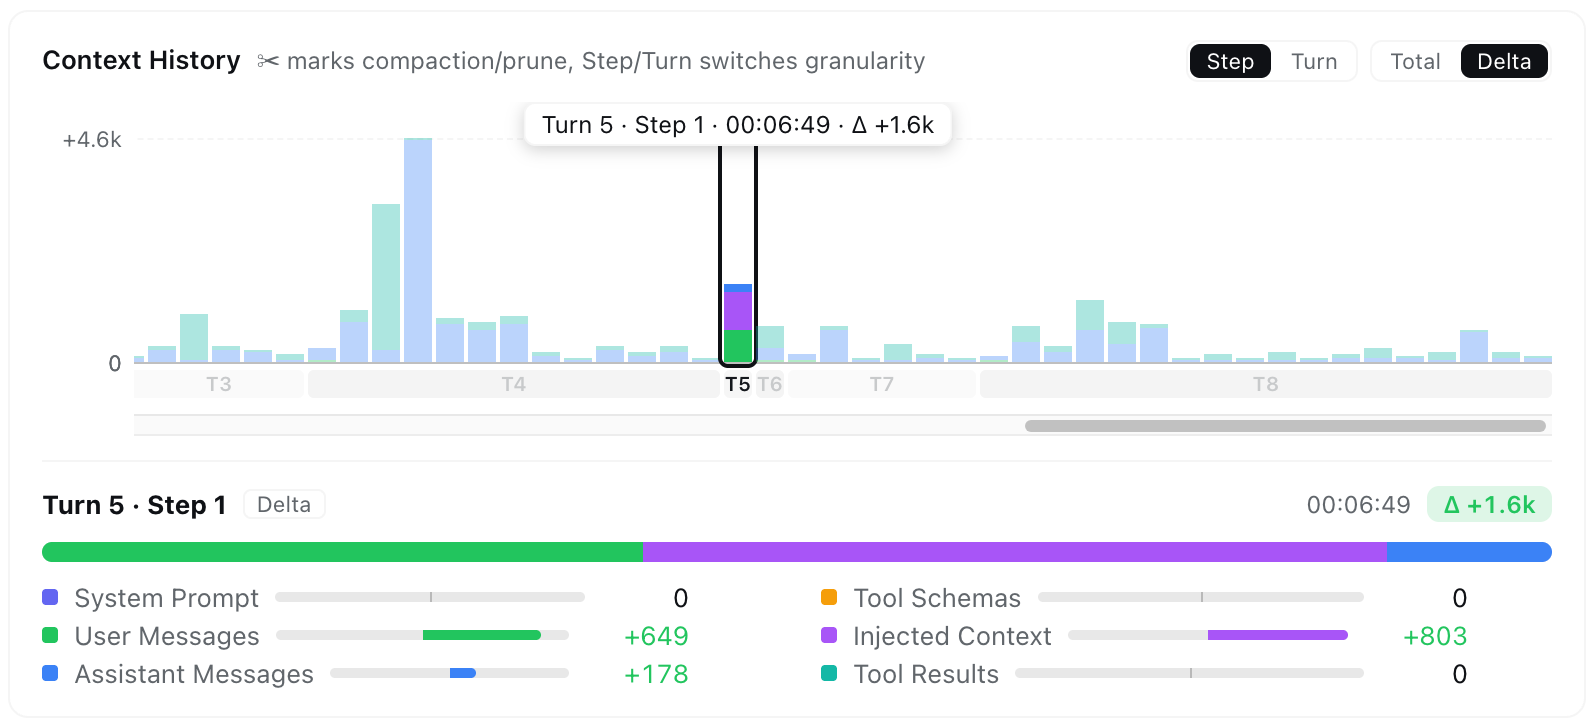
Diff against the previous turn — signed delta badges per category (+N items, ±Nk tokens) tell you what a turn added or reclaimed at one glance. Steps older than a compaction are reconstructed from the removed-message archive — and the card says so when a step's makeup is only approximate.
DNA mode lays the whole context out flat — the bar draws one band per item in the model's reading order, and below it the same items become one flat list with the newest message on top (the model reads oldest-first, so the list runs that order bottom-up): every row carries its prompt position (#12), category, introducing step, and token price, and expands into the same full content; the tool schemas and the system prompt close the list as two group rows. The card is capped at three times the height of the composition + trend cards beside it — a fully flattened session scrolls inside instead of flooding the page.
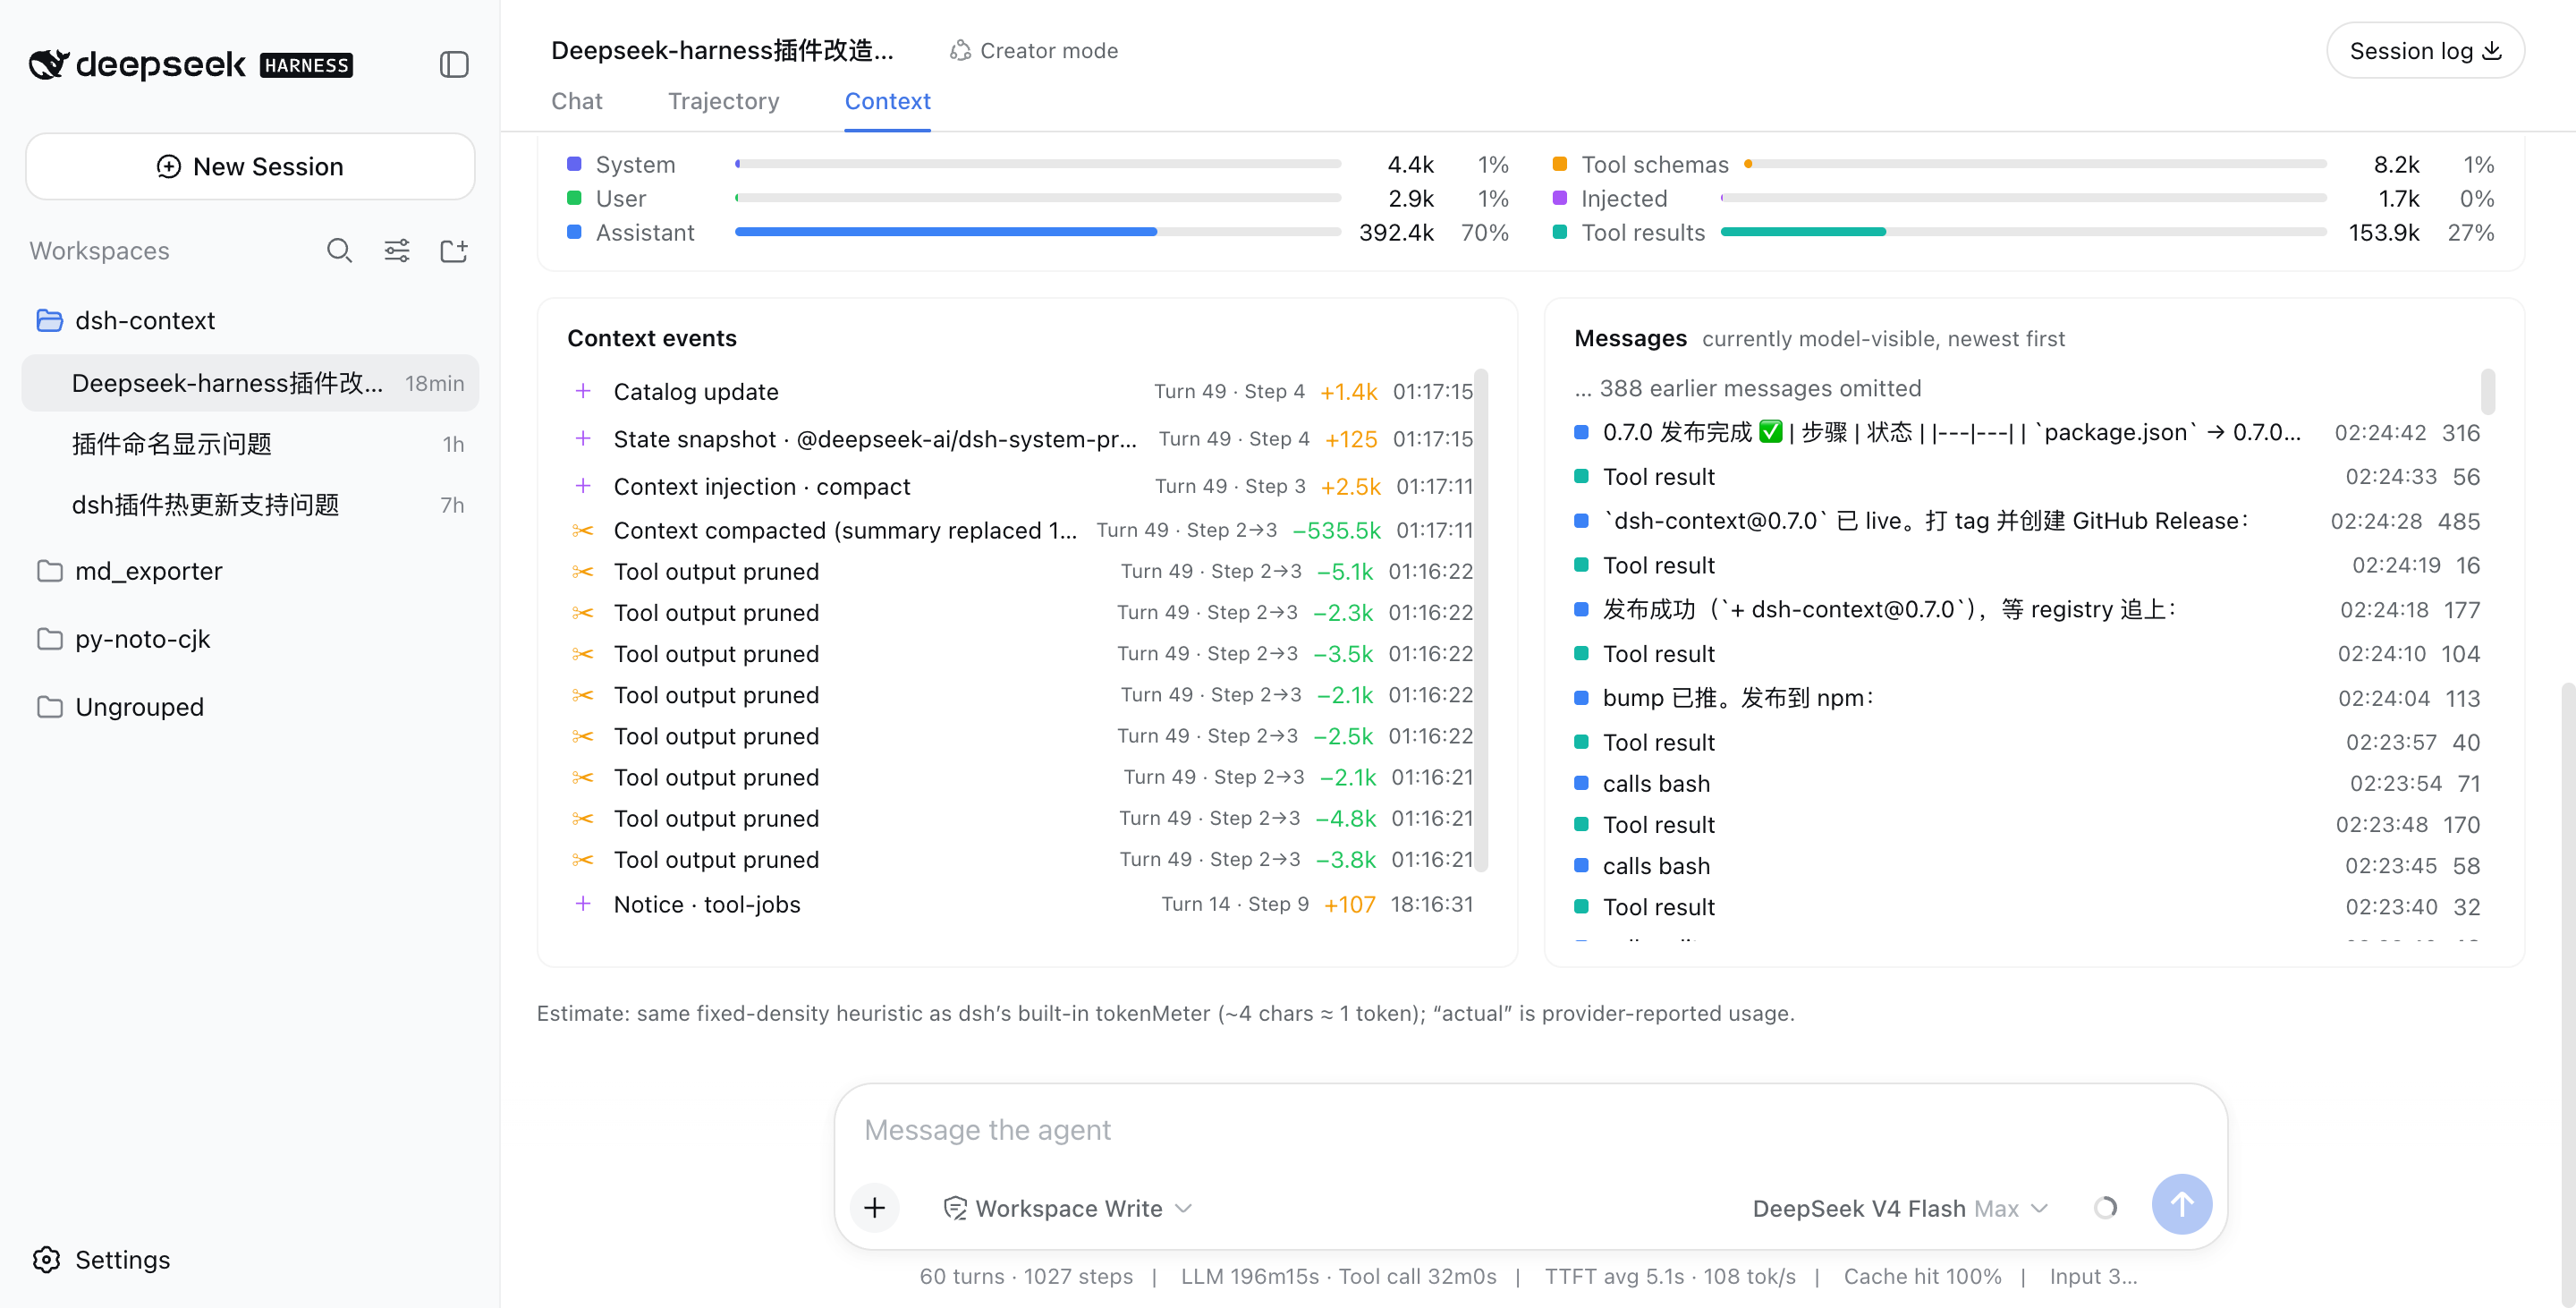
Every injection, compaction, prune, model switch, and plan-mode toggle — labeled with its producer (instruction file, plugin id, skill name), its net token delta (compactions show what they reclaimed), turn/step, and time. The Inject / Compact / Prune / Switch / Mode chips filter the log by kind, each carrying its whole-session event tally.
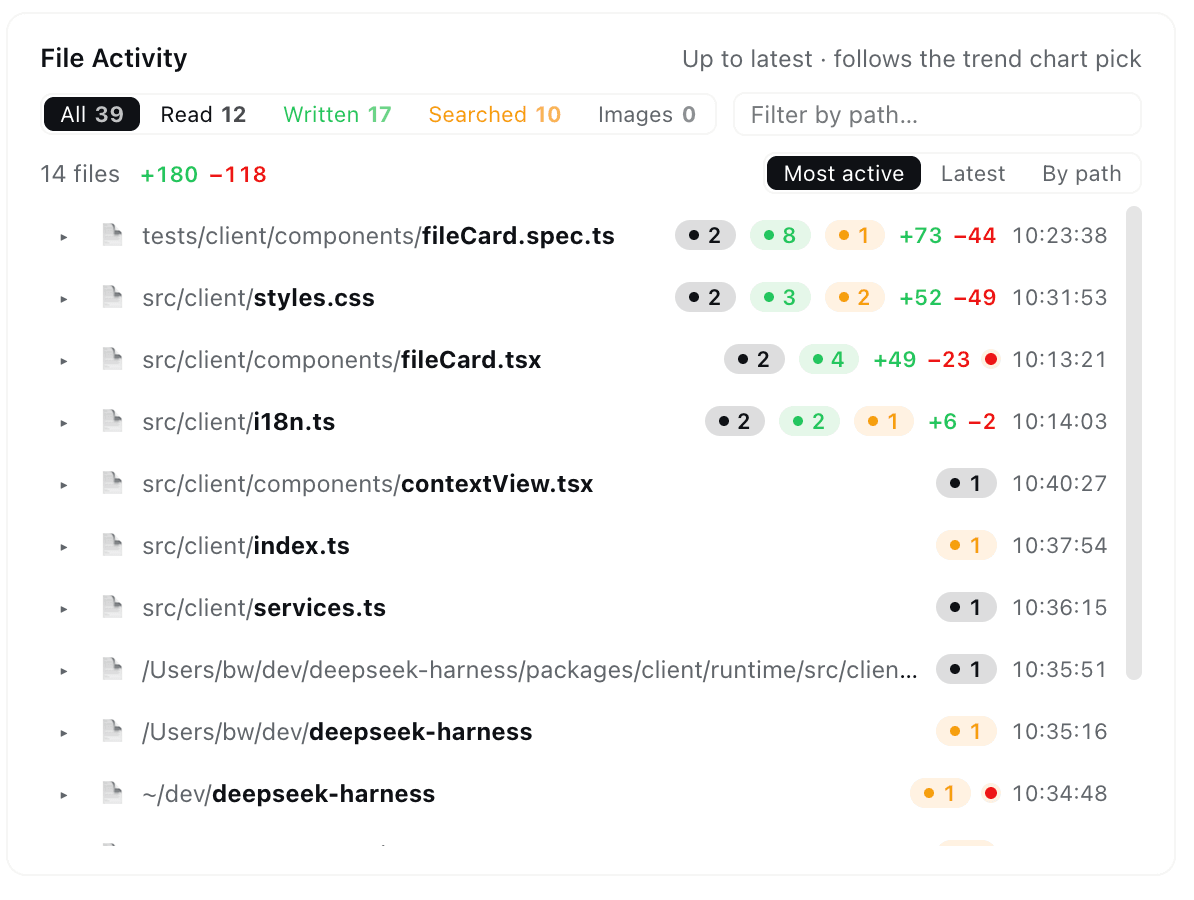
One row per touched file — read, written, or searched — aggregated up to whichever step you pick on the trend chart:
edit/write contributes its estimated +added / −removed footprint, per file and summed.str_replace_editor, and the nested calls inside PTC run_code programs are all folded into per-tool rows.Open any session and click the Fleet / 编队 tab (right of Context) — the agent family on a page of its own, with room for the collaboration surfaces that follow:
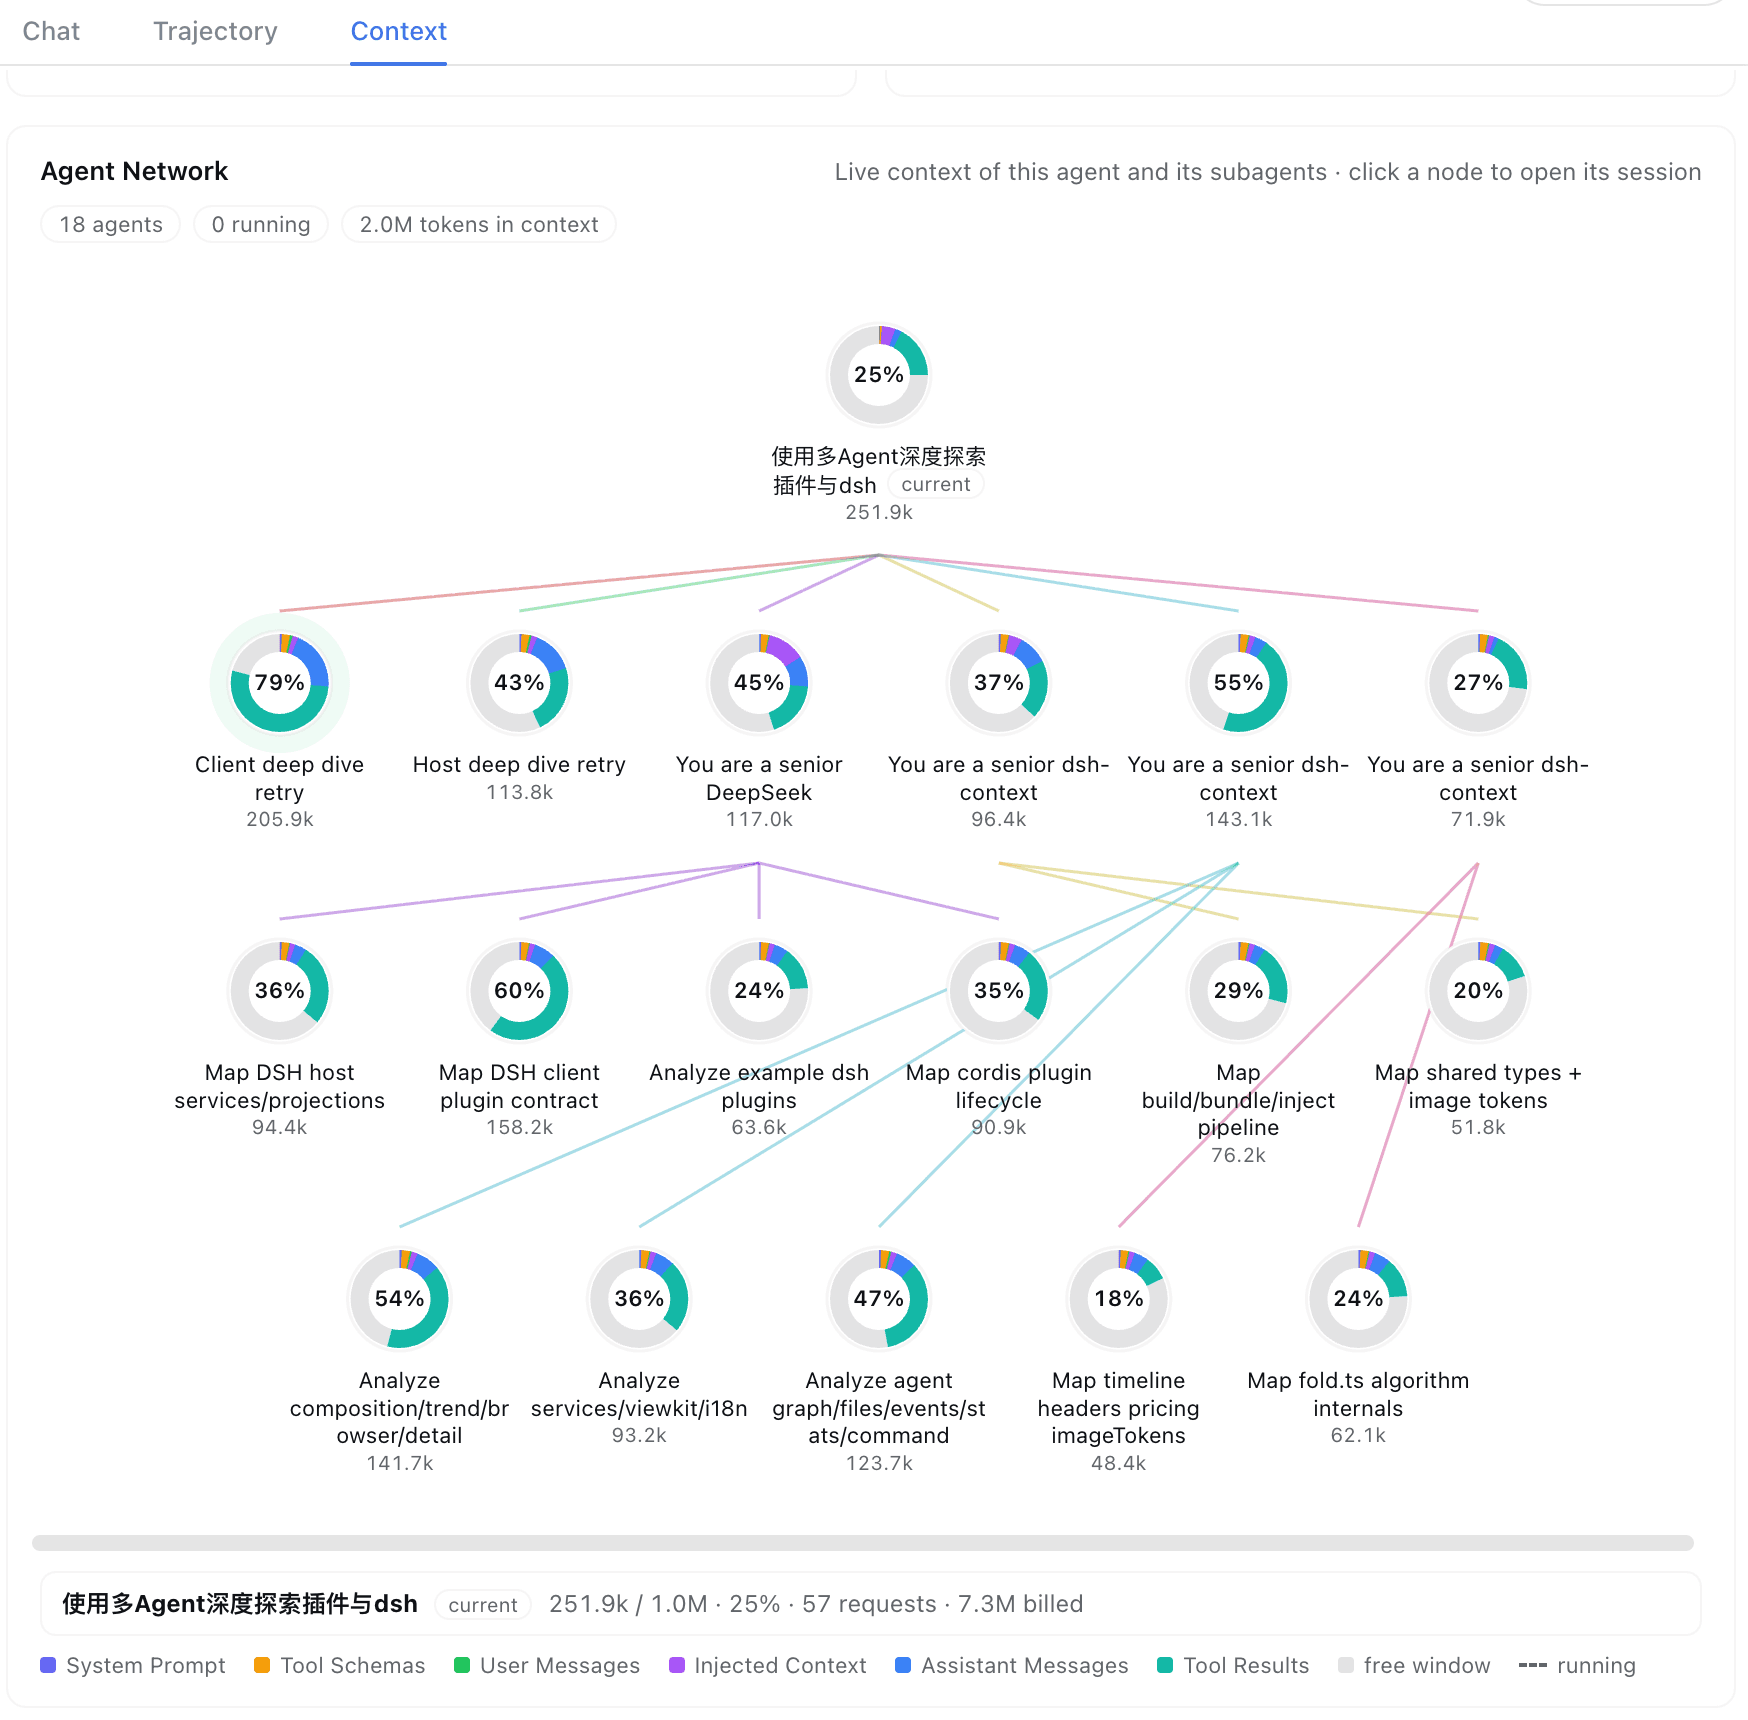
The current agent, its parents, and every subagent — one card per agent: its title, live context size and window occupancy, a composition bar, and how long it has run for and how many steps it has taken. Edges fan out from each parent in the lineage's color — hover a card to light its whole chain and read the full breakdown in the detail strip; click to jump into that session's own Context tab. Running agents breathe with a green pulse on their incoming edge and turn over the harness's own rolling spinner beside their title, which settles into the same green dot the header's subagent list uses once the work is done; narrow panes fold the family into tidy rows — never a horizontal scrollbar.
The right Sidebar's Context panel keeps the same card inline, so the family stays one click away while you read the chat. Don't want the tab at all? Turn Fleet tab off in the preferences card — the card then lives on in that panel, and the Context tab's family cell opens it there whenever a Sidebar is served.
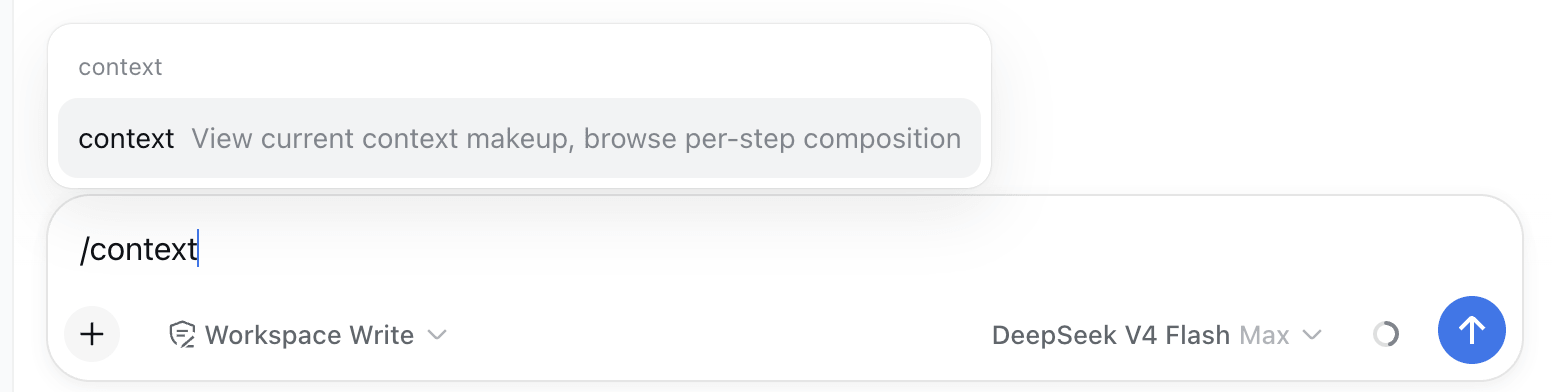
/context commandType /context (or pick it from the / menu) and press Enter:
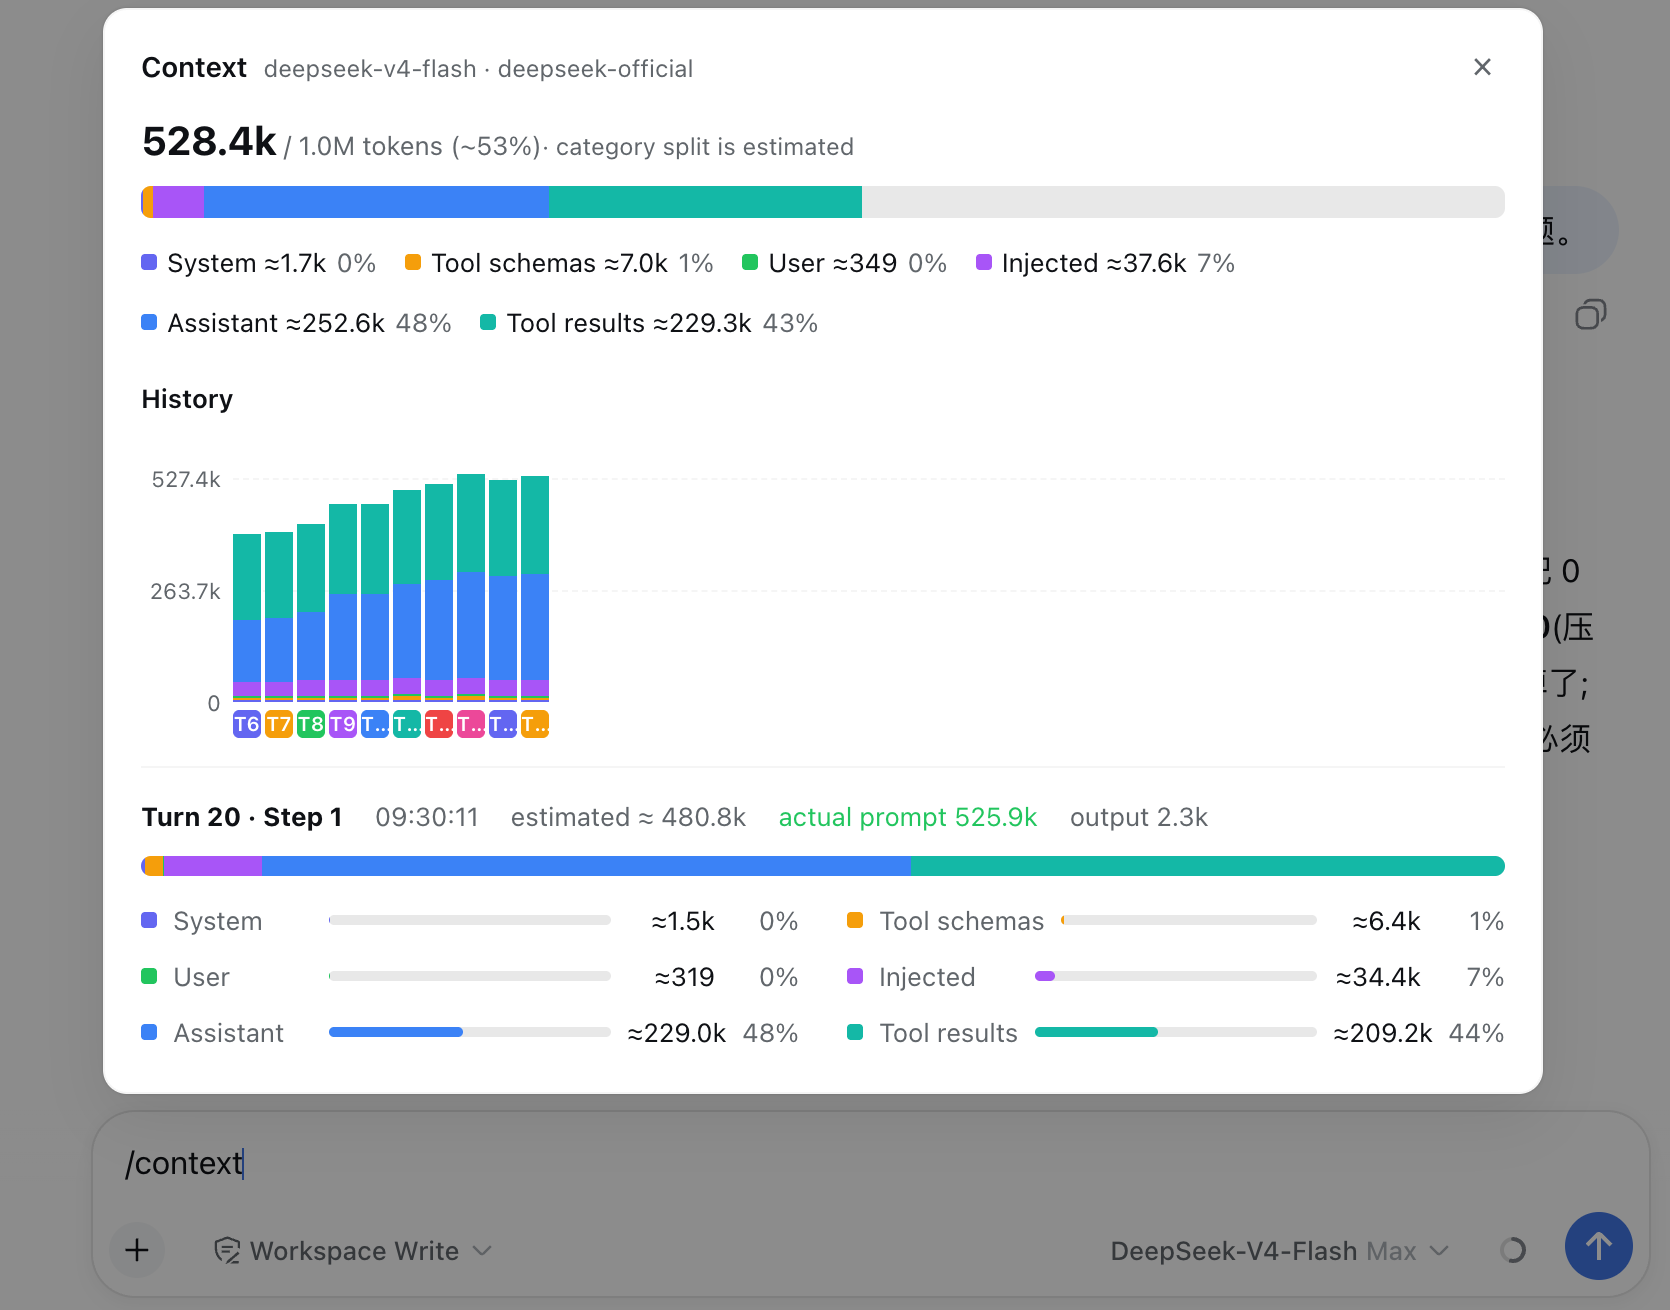
A centered dialog opens with the Current Composition card and the Context browser — the same composition bar, per-step picker, and vs previous turn diff badges as the tab:
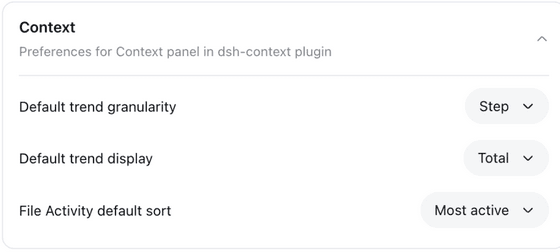
The Context preferences card holds this plugin's per-user settings — default placement (the Context and Fleet conversation tabs, the right Sidebar panel, or both), the Fleet tab's own Show/Hide switch, trend granularity (Step/Turn), trend mode (Total/Delta), the trend duration curve (shown by default), tool and File Activity sort, and the sidebar insights entry. It lives on the Plugins page: the sidebar Plugins entry → the dsh-context bundle's page → its Configuration section (the card is served by the entry's live Config form).
The System Prompt · Prefix / Suffix rows hold free text joined at the very start / end of every session's system prompt, for all agents (subagents included) — a per-deployment persona or behavioral rule that rides the harness's own prompt assembly. Edits apply from the next turn; leave a row empty to disable it.
In-chart and in-card toggles stay per-view and never overwrite the stored preference.
@deepseek-ai/dsh 0.1.7-rc.2+ (the 0.1.7 line from rc.2 and the 0.2.0 line from rc.2), the V4 session-log generation, from one shape-driven code path. The per-release matrix and how it is verified: docs/compatibility.md.If dsh-context helped you understand what your agent is carrying around, a ⭐ on GitHub is much appreciated — and issues/PRs are welcome!
FAQs
A DeepSeek Harness plugin for context insight and management, with context dashboard and context command, for understanding how the context is made of, and how it evolves.
The npm package dsh-context receives a total of 39,491 weekly downloads. As such, dsh-context popularity was classified as popular.
We found that dsh-context demonstrated a healthy version release cadence and project activity because the last version was released less than a year ago. It has 1 open source maintainer collaborating on the project.
Security News
Cloudflare is acquiring Deno’s team, which will provide another year of bug fixes and security updates before ending support for the runtime.
Security News
Anthropic’s free OSS Scanner uses Mythos and other Claude models to find open source vulnerabilities and send maintainers reports with proposed fixes.

Security News
On Front Lines’ Early Adopters: CISO podcast, Andrew Becherer shares lessons from Datadog, weighs the long-term costs of AI-built tools, and explains how founders can actually gain a CISO’s trust.