Elastic APM NodeJS Logger
Announcements
- Version 1.0.8 onwards - Note that there have been some syntax changes on how authentication is done to accomodate for authentication for self-hosted Elasticsearch DB instances. You can read more about it HERE
Motivation
As of 25th Aug 2022, the official elastic-apm-node NPM library does not send the STDOUT logs of the nodejs application that it is installed on to back to your designated Elastic Stack, and you will have to use Filebeat (separate Golang process) to send the logs back - https://ela.st/nodejs-apm-filebeat.
Hence this NPM library aims to bridge this gap by allowing you to send logs back together with your metrics from within your NodeJS App (no separate Golang process required)
Before:
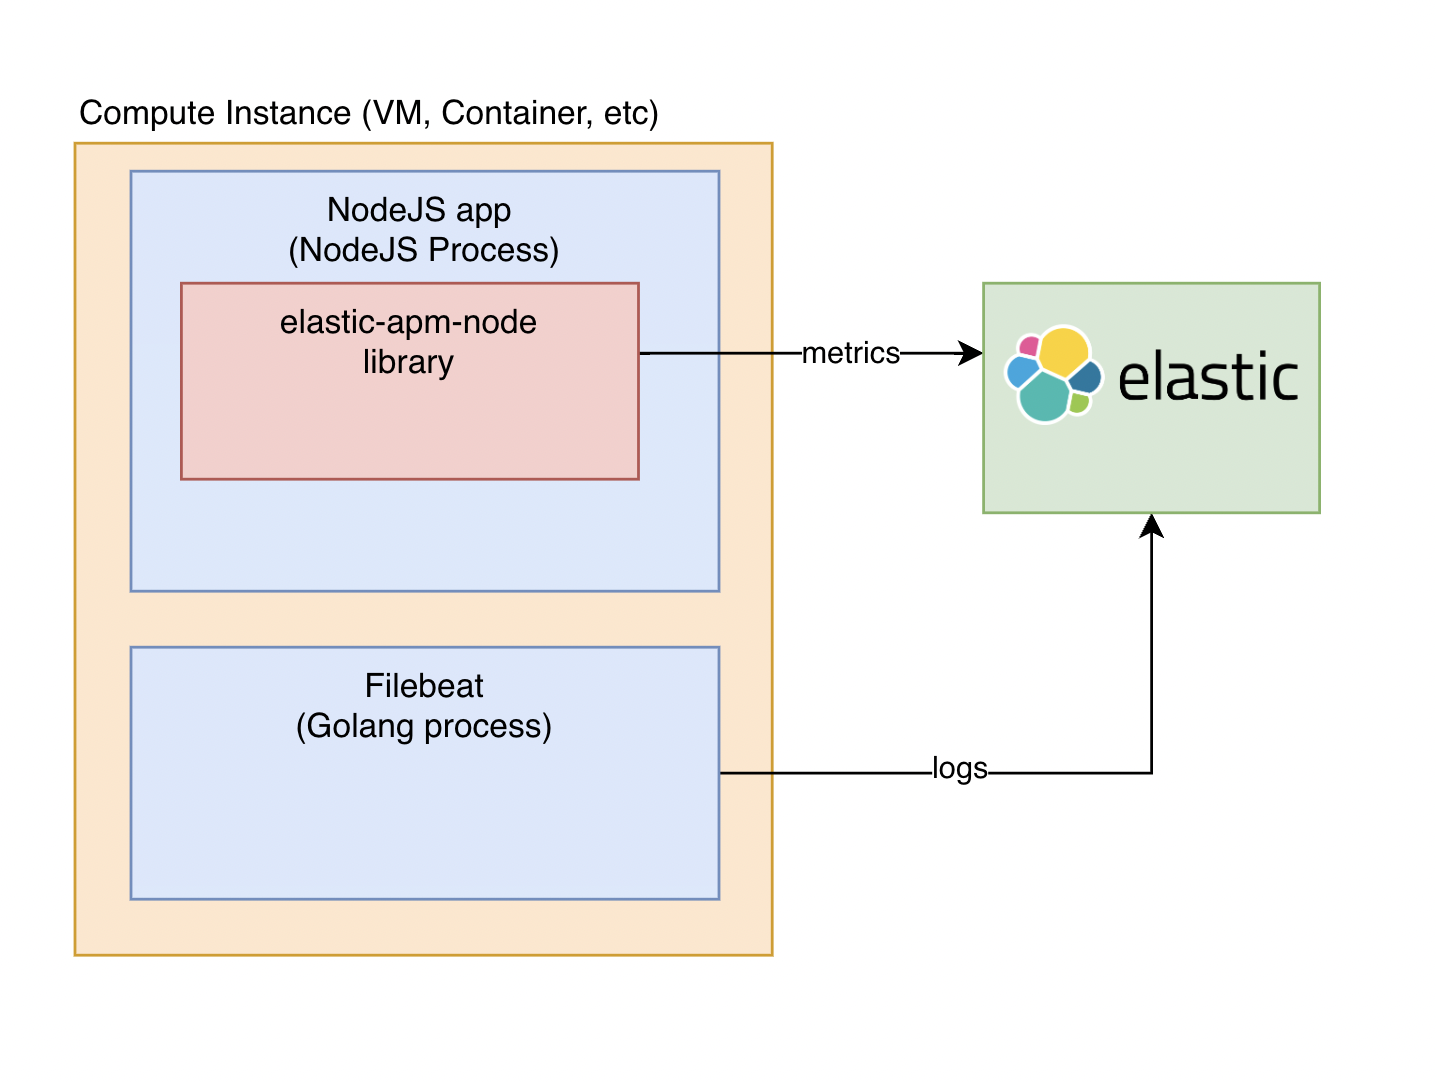
After:

Further Details
This is so that under your Observability > APM > Services > Your NodeJS App, the Logs section will no longer be blank. Apart from that, it also enables your NodeJS app's APM spans and traces to be correlated with the logs that get sent back by this NPM library. Correlation occurs via the "service.name"/"Service Name" Elastic Common Schema field - https://www.elastic.co/guide/en/ecs/current/ecs-service.html#field-service-name.
I have faith that our Elastic engineering team might build this feature into the official elastic-apm-node npm library soon enough. Until that day comes, this library easily bridges that gap.
Setup
Ensure that you have elastic-apm-node installed, so that your NodeJS's app's metrics get sent back to the Elastic Stack. If you haven't then follow this guide first - https://www.elastic.co/guide/en/apm/agent/nodejs/current/express.html
Once this has been done, you can install this library:
npm install elastic-apm-node-logger
Full Usage Example
Below is an example for how one can use this library.
For ECS formatted logs, please scroll down, there is a separate section which covers that.
Example:
const ELASTIC_CLOUD_ID = '*** Your Elastic Cloud ID Here ***'
const APM_SERVICE_NAME = 'joshua-api-server-v1'
const ELASTICSEARCH_API_KEY = '*** Your API Key ***'
const APM_SERVER_SECRET_TOKEN = '*** Your APM Secret Token ***'
const APM_SERVER_URL = ' *** Your APM Server HTTPS URL ***'
const apm = require('elastic-apm-node').start({
serviceNodeName: APM_SERVICE_NODE_NAME,
serviceName: APM_SERVICE_NAME,
secretToken: APM_SERVER_SECRET_TOKEN,
serverUrl: APM_SERVER_URL
})
const elasticApmLogger = require('elastic-apm-node-logger')
elasticApmLogger.startLogging({
esAuthObject: {
cloud: { id: ELASTIC_CLOUD_ID },
auth: { apiKey: ELASTICSEARCH_API_KEY }
},
serviceName: APM_SERVICE_NAME,
apmObject: apm
})
require('dotenv').config()
const bodyParser = require('body-parser')
const express = require('express')
const expressjsLogger = require('morgan')
const app = express()
app.use(bodyParser.json())
app.use(bodyParser.urlencoded({ extended: true }))
app.use(expressjsLogger('combined'))
app.get('/', (req, res) => {
console.log('Hello this is some log message 🔥🔥🔥🔥🔥')
console.log('Hello this is some log message 🤩🤩🤩🤩🤩')
res.json({ status: 'ExpressJS nodejs server is running!' })
})
app.get('/test_message', (req, res) => {
console.log('This is a test message')
myFunctionA()
res.json({ message: 'Hello World to Everyone!' })
})
function myFunctionA () {
console.log('Function A ✅')
myFunctionB()
}
function myFunctionB () {
console.log('Function B ✅✅')
}
console.log('Server running at http://127.0.0.1:80/')
app.listen(process.env.PORT || 80)
That's about it!
You should see your logs coming in now under the Services > Your Service > Logs tab.
If you are looking to format your logs into ECS Format before sending it back, please refer to the next section.
Authentication
Since this library internally uses the @elastic/elasticsearch npm library, we will also then follow the same method of authentication, by accepting an object of the same format.
Please see https://www.elastic.co/guide/en/elasticsearch/client/javascript-api/current/client-connecting.html#authentication for more details.
It is essentially the object that the Client accepts in the @elastic/elasticsearch npm library.
Here are some examples on how you can authenticate:
Using Cloud ID and API Key:
You can use the Cloud ID and API key to authenticate. This is usually used for Elastic Cloud instances:
const ELASTIC_CLOUD_ID = '*** Your Elastic Cloud ID Here ***'
const APM_SERVICE_NAME = 'joshua-api-server-v1'
const ELASTICSEARCH_API_KEY = '*** Your API Key ***'
const APM_SERVER_SECRET_TOKEN = '*** Your APM Secret Token ***'
const APM_SERVER_URL = ' *** Your APM Server HTTPS URL ***'
const apm = require('elastic-apm-node').start({
serviceNodeName: APM_SERVICE_NODE_NAME,
serviceName: APM_SERVICE_NAME,
secretToken: APM_SERVER_SECRET_TOKEN,
serverUrl: APM_SERVER_URL
})
const elasticApmLogger = require('elastic-apm-node-logger')
elasticApmLogger.startLogging({
esAuthObject: {
cloud: { id: ELASTIC_CLOUD_ID },
auth: { apiKey: ELASTICSEARCH_API_KEY }
},
serviceName: APM_SERVICE_NAME,
apmObject: apm
})
Using Username and Password:
You can use username and password to authenticate. This is usually used for self managed Elasticsearch instances (hosted on AWS EC2 etc):
const ELASTICSEARCH_DB_URL = '*** Your Elasticsearch database URL Here ***'
const APM_SERVICE_NAME = 'joshua-api-server-v1'
const ELASTICSEARCH_API_KEY = '*** Your API Key ***'
const APM_SERVER_SECRET_TOKEN = '*** Your APM Secret Token ***'
const APM_SERVER_URL = ' *** Your APM Server HTTPS URL ***'
const ELASTICSEARCH_DB_USERNAME = '*** Your Elasticsearch database username here***'
const ELASTICSEARCH_DB_PASSWORD = '*** Your Elasticsearch database password here***'
const apm = require('elastic-apm-node').start({
serviceNodeName: APM_SERVICE_NODE_NAME,
serviceName: APM_SERVICE_NAME,
secretToken: APM_SERVER_SECRET_TOKEN,
serverUrl: APM_SERVER_URL
})
const elasticApmLogger = require('elastic-apm-node-logger')
elasticApmLogger.startLogging({
esAuthObject: {
node: ELASTICSEARCH_DB_URL,
auth: {
username: ELASTICSEARCH_DB_USERNAME,
password: ELASTICSEARCH_DB_PASSWORD
}
},
serviceName: APM_SERVICE_NAME,
apmObject: apm
})
ECS (Elastic Common Schema) Formatters
You can also format your logs into ECS format before sending it back using popular NodeJS logging libraries like morgan, pino or winston - https://www.elastic.co/guide/en/ecs-logging/nodejs/current/intro.html
The elastic-apm-node-logger library will then ✨intelligently detect✨ if the logs are in ECS formatted JSON and send those back accordingly, no other configuration required!
Caveats
This library inadvertably creates an Elasticsearch "Dependency" icon on your "Service Maps" view, as it sends your logs back directly to your Elasticsearch Database instance.
Contributing
In lieu of a formal style guide, take care to maintain the existing coding style. Add unit tests for any new or changed functionality. Lint and test your code.


