gl-bench 


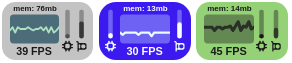
WebGL performance monitor that showing percentage of GPU/CPU load.
Screenshots
Examples / e2e tests
Pros and cons
| Pros | Cons |
|---|
| CPU/GPU percentage load | Shipped only with ES6 classes |
| Cool themes and loggers | Size not so tiny |
| Chart show inactive page or significant performance drop | |
| Two and more measuring in one loop | |
| Support for devices with 120+ FPS | |
| Web workers support | |
| Typescript support | |
| It is 2x faster than Stats.js in Chrome accorging to stress test | |
How it works
For GPU/CPU synchronization I am use gl.getError(), it is better than gl.readPixels() at least for me. Code is asynchronous and not stall rendering pipeline by hitting CPU limit due to waiting GPU answer, so you can calculate your heavy physics on CPU with this monitor. If you want turn off GPU tracking just press on it with one click. Check online examples/e2e tests to find out how it works. Version 1 used the EXT_disjoint_timer_query extension, but it not supported on some pc anymore.
Usage with Three.js
Add script on page from npm or jsdelivr/unpkg and wrap monitored code with begin/end marks
import GLBench from 'gl-bench/dist/gl-bench';
let bench = new GLBench(renderer.getContext());
function draw(now) {
bench.begin();
bench.end();
bench.nextFrame(now);
}
renderer.setAnimationLoop((now) => draw(now));
Using TypeScript
Replace import GLBench from 'gl-bench/dist/gl-bench'; into import GLBench from 'gl-bench/dist/gl-bench.module';
Profiling with another WebGL frameworks
let gl = canvas.getContext('webgl') || canvas.getContext('experimental-webgl');
let bench = new GLBench(gl);
function draw(now) {
bench.begin('first measure');
bench.end('first measure');
bench.begin('second measure');
bench.end('second measure');
bench.nextFrame(now);
requestAnimationFrame(draw);
}
requestAnimationFrame(draw);
Custom settings
let bench = new GLBench(gl, {
css: 'newStyleString',
svg: 'newSvgString',
dom: newDomContainer,
withoutUI: false,
trackGPU: false,
chartHz: 20,
chartLen: 20,
paramLogger: (i, cpu, gpu, mem, fps, totalTime, frameId) => { console.log(cpu, gpu) },
chartLogger: (i, chart, circularId) => { console.log('chart circular buffer=', chart) },
};
Contributing
Fork this repository and install the dependencies, after that you can start dev server with npm run dev
and open examples in browser localhost:1234.