Product
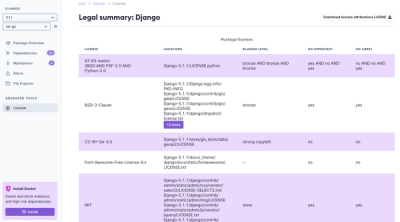
Introducing License Enforcement in Socket
Ensure open-source compliance with Socket’s License Enforcement Beta. Set up your License Policy and secure your software!
By Philipp Burckhardt - Oct 17, 2024
graphql2chartjs
Advanced tools
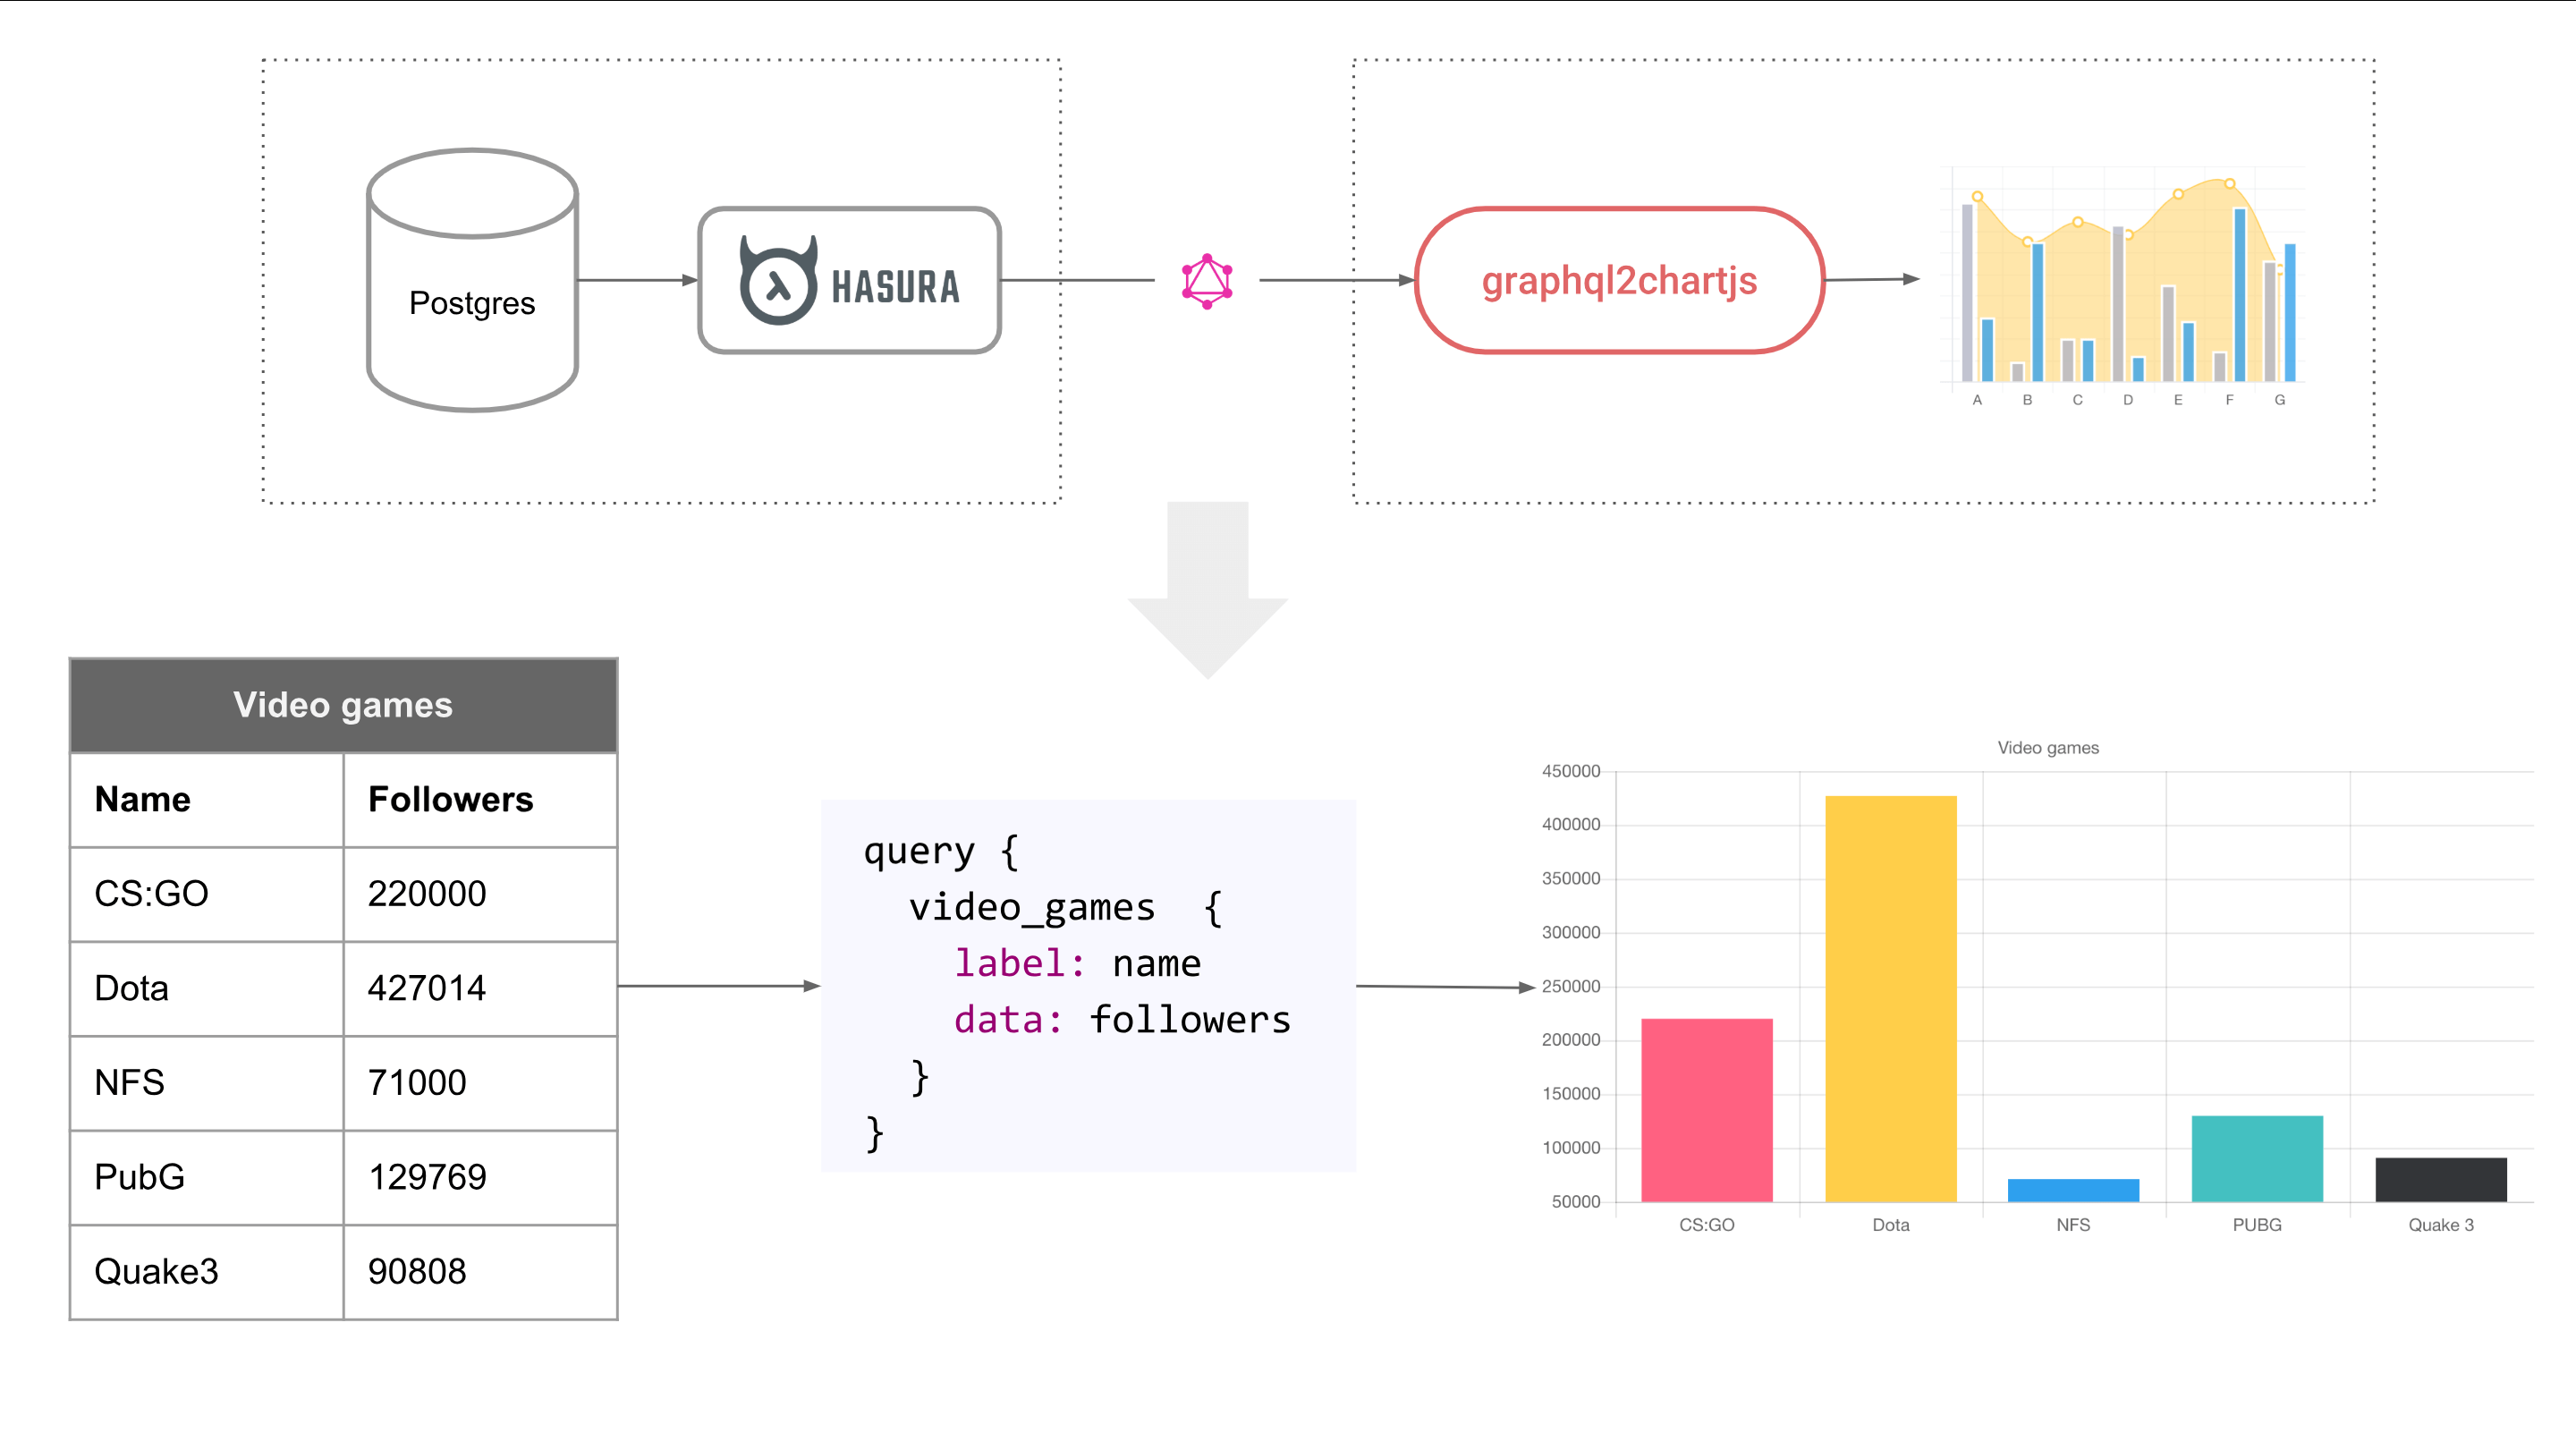
`graphql2chartjs` reshapes your GraphQL data as per the [ChartJS](https://chartjs.org) API. This makes it easy to query a GraphQL API and render the output as a ChartJS chart.
graphql2chartjs reshapes your GraphQL data as per the ChartJS API. This makes it easy to query a GraphQL API and render the output as a ChartJS chart.
For example, if you're using Postgres and Hasura, this is what using graphql2chartjs looks like:
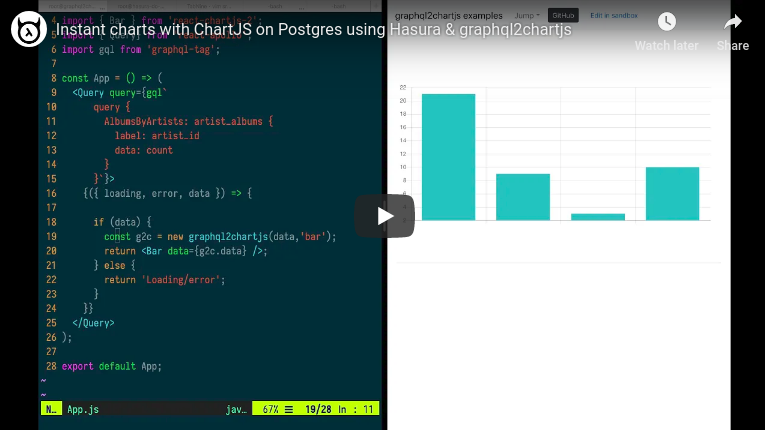
We've set up a GraphQL server with continuously changing data, so that you can try graphql2chartjs out easily.
| View live charts | Edit in sandbox | Open GraphiQL |
|---|
The demo above cover the following types of charts: basic, multiple datasets, mixed chart-types, realtime chart with live data, realtime time-series
Hasura gives you an instant realtime GraphQL API on an existing Postgres database. You can create views to capture analytics and aggregations on your database and instantly turn them into charts.
Watch this video below to see a demo/tutorial of using Hasura with an existing Postgres database, creating views and building charts.
import {Query} from 'react-apollo';
import gql from 'graphql-tag';
import graphql2chartjs from 'graphql2chartjs';
import {Bar} from 'react-chartjs-2';

const Chart = () => (
  <Query
    query={gql`
      query {
        Articles: articleStats {
          label: title
          data: num_likes
        }
      }`}
    }>
    {({data} => {
      if (data) {
        const g2c = new graphql2chartjs(data, 'bar');
        return (<Bar data={g2c.data} />);
      }
      return null;
    }
  </Query>
);
Different types of charts need different structures in their datasets.
For example a bar chart dataset needs labels and data associated for each label; the ChartJS API refers to this as label and data. Once you alias fields in your graphql query to label and data, and pass the response through graphql2chartjs, your dataset is ready to be used by bar chart in chartjs.
Charts of this type need 2 data inputs, label and data.
query {
  ArticleLikes : articles {
    label: title
    data: likes
  }
}
Charts of this type need 2 data inputs: data_x, data_y (and data_r for bubble).
query {
  ArticleLikesVsComments : articles {
    data_x: num_likes
    data_y: num_comments
  }
}
Charts of this type need 2 data inputs, data_x or data_t and data_y. Note that there is no label.
query {
  StockPrices : stockprice {
    data_t: created
    data_y: price
  }
}
graphql2chartjs works in 3 steps:
const g2c = new graphql2chartjs()g2c.add(graphqlResponse.data, 'line')g2c.datanew graphql2chartjs()graphql2chartjs(data, chartType)
const g2c = new graphql2chartjs(data, 'bar');
data: This is your GraphQL response. This data should have fields label, data etc. as per the GraphQL querying described above.chartType: This is a string that represents valid values of what your chart type is. Valid values include 'line', 'bar', 'radar', 'doughnut', 'pie', 'polarArea', 'bubble', 'scatter'.Notes:
graphql2chartjsgraphql2chartjs(data, transform)
The transformation function can add chartjs dataset props or even modify the record data:
const g2c = new graphql2chartjs(data, (datasetName, dataPoint) => {
  return {
    chartType: 'bar',
    backgroundColor: 'yellow'
  };
});
transform(datasetName, dataPoint): This function defined by you can take the name of the dataset and the data record that comes from the GraphQL response and returns an object that can should have the chartType key and optionally other keys that specify other dataset properties.
{
  chartType: 'line', // Or 'line', 'bar', 'radar', 'doughnut', 'pie', 'polarArea', 'bubble', 'scatter'
  <other keys as per the dataset properties per chart. Refer to the link below>
}
chartType: This should be a string value, one of: 'line', 'bar', 'radar', 'doughnut', 'pie', 'polarArea', 'bubble', 'scatter'g2c.datag2c.data gives you access to the latest ChartJS data that can be passed to your chart.
var myChart = new Chart(ctx, { data: g2c.data });
<Bar data={g2c.data} />
g2c.add()
Once you've initialised a graphql2chartjs object, you can use the add function to add data for the first time or incrementally:
await data = runQuery(..);

// Add for a chart type
g2c.add(data, 'line');

// Add with a transformation function to change UI props for the new data added or udpated
g2c.add(data, (datasetName, dataPoint) => {
  chartType: 'line',
  pointBackgroundColor: 'yellow'
});
npm install --save graphql2chartjs
<script src="https://storage.googleapis.com/graphql-engine-cdn.hasura.io/tools/graphql2chartjs/index.js" type="application/javascript"></script>
reform()You can reform the existing data in your graphql2chartjs instance using the reform function that takes a reformer function as an argument. This reformer function is run over every datapoint in every dataset. For instance, to scale the x and y coordinates, you would do something like:
g2c.reform((datasetName, dataPoint) => {
  // scale the x, y coordinates
  return {
    data_x: scalingFactor(dataPoint.data_x),
    data_y: scalingFactor(dataPoint.data_y)
  }
})
FAQs
`graphql2chartjs` reshapes your GraphQL data as per the [ChartJS](https://chartjs.org) API. This makes it easy to query a GraphQL API and render the output as a ChartJS chart.
The npm package graphql2chartjs receives a total of 98 weekly downloads. As such, graphql2chartjs popularity was classified as not popular.
We found that graphql2chartjs demonstrated a not healthy version release cadence and project activity because the last version was released a year ago. It has 1 open source maintainer collaborating on the project.
Did you know?

Socket for GitHub automatically highlights issues in each pull request and monitors the health of all your open source dependencies. Discover the contents of your packages and block harmful activity before you install or update your dependencies.
Product
Ensure open-source compliance with Socket’s License Enforcement Beta. Set up your License Policy and secure your software!
Product
We're launching a new set of license analysis and compliance features for analyzing, managing, and complying with licenses across a range of supported languages and ecosystems.
Product
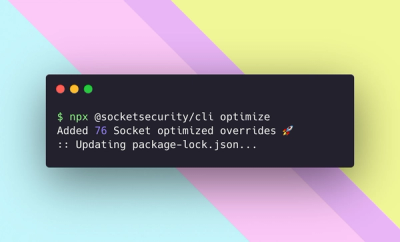
We're excited to introduce Socket Optimize, a powerful CLI command to secure open source dependencies with tested, optimized package overrides.