Product
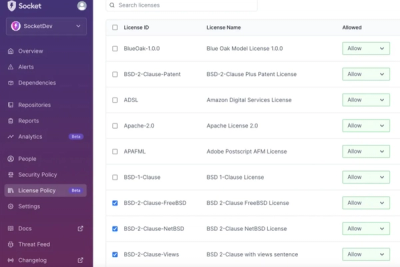
Introducing License Enforcement in Socket
Ensure open-source compliance with Socket’s License Enforcement Beta. Set up your License Policy and secure your software!
By Philipp Burckhardt - Oct 17, 2024
![]()
A terminal-based heap allocation plotter for Node.js
Plots memory usage & garbage collection stats by V8's trace-based GC
npm i heapstats
Run a leaky-prone function 100 times & check if it leaks:
import Heapstats from 'heapstats'

const heap = Heapstats()

for (let i = 0; i < 100; i++)
  heap.sample(() => addTwoNumbers(5, 3))

console.log(heap.stats().plot)
Same as above but this time it's an async function:
import Heapstats from 'heapstats'

const heap = Heapstats()

for (let i = 0; i < 100; i++)
  await heap.sample(() => addTwoNumbers(5, 3))

console.log(heap.stats().plot)
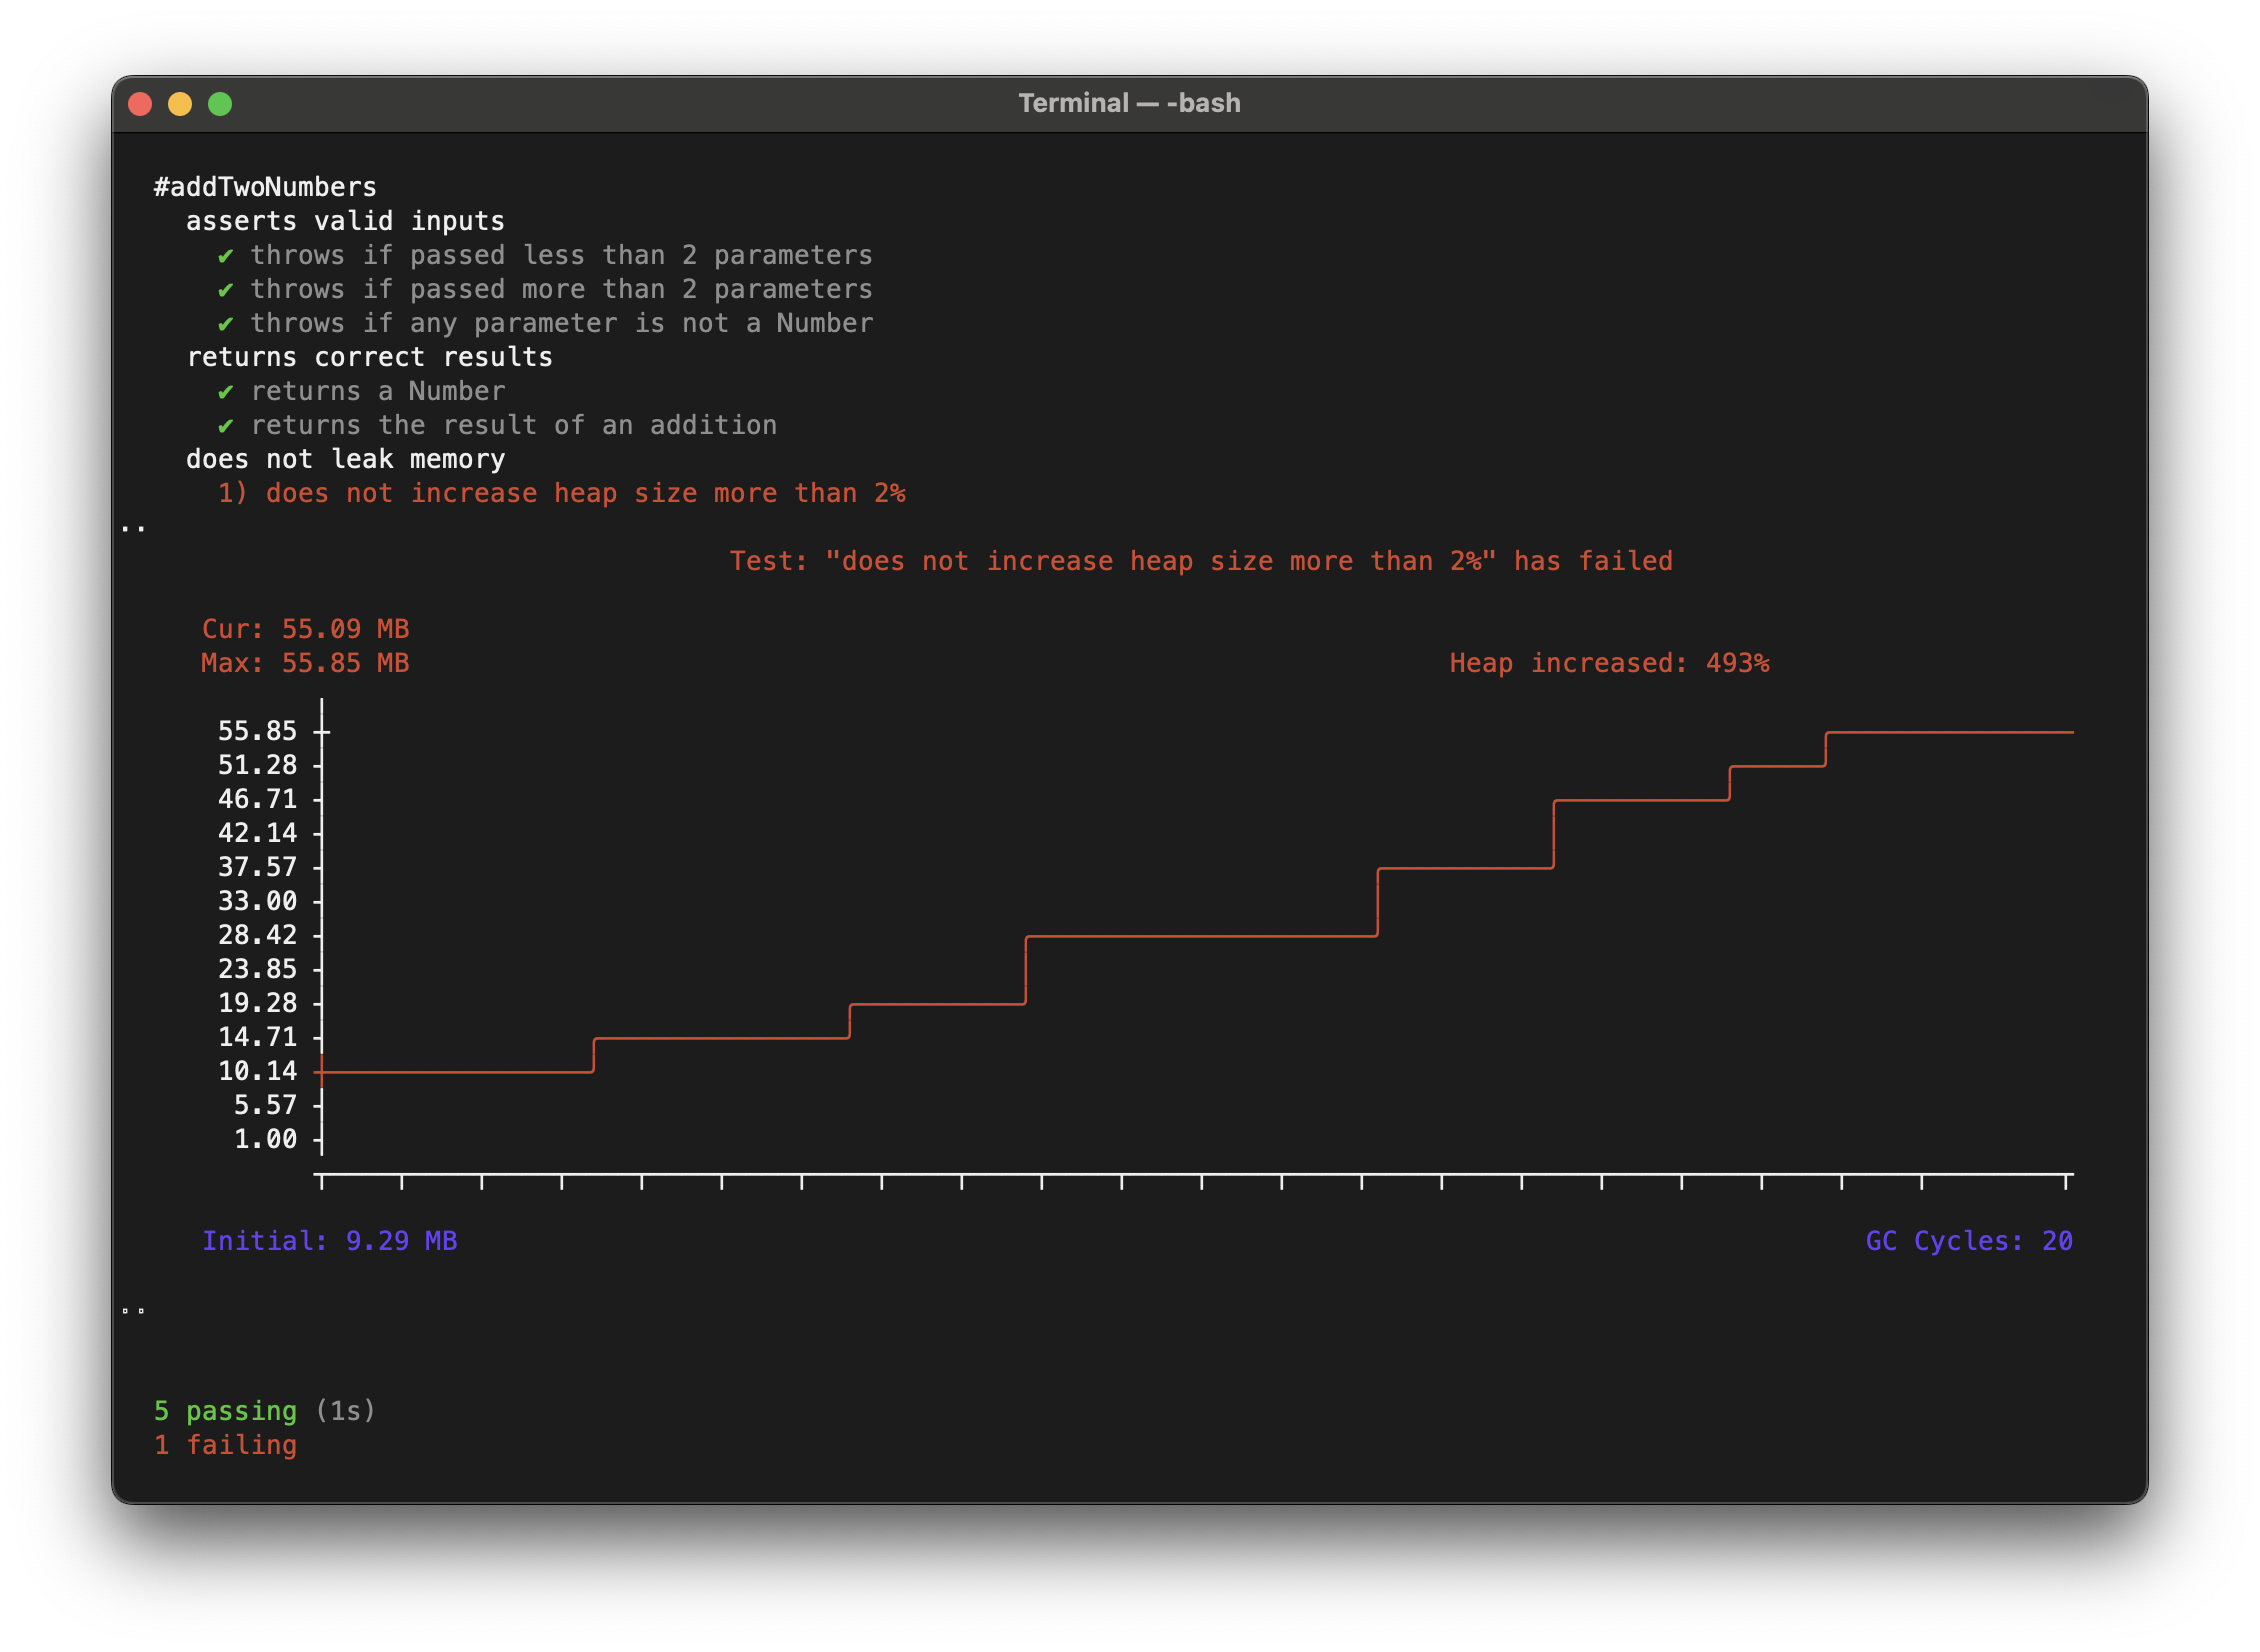
Assuming it does leaks memory, you'll see something like this:
                      Heap Allocation Timeline

Cur: 21.79 MB
Max: 56.77 MB              Heap increased: 376%
      ╷
56.77 ┼                                 ╭─╮
45.62 ┤                            ╭────╯ │    ╭────╮     ╭────╮
34.46 ┤                      ╭─────╯      ╰────╯    │  ╭──╯    │
23.31 ┤            ╭────╮  ╭─╯                      ╰──╯       ╰─
12.15 ┤       ╭────╯    ╰──╯
 1.00 ┼───────╯
      ┬───┬───┬───┬───┬───┬───┬───┬───┬───┬───┬───┬───┬───┬───┬──

Initial: 4.57 MB                                   GC Cycles: 27
When testing something indeterminate, like an HTTP request, just
instantiate it, do whatever work needs to be done and then get .stats()
as usual.
For example:
const heap = Heapstats()

app.get('/users', (req, res) => {
  const users = await leakyDatabaseCall()

  res.json(users)

  console.log(heap.stats().plot)
})
It starts collecting memory stats when you instantiate it - that is if a garbage collection/compaction actually takes place.
No need to call sample(() => someFunction()) in this case.
Apart from the ASCII plot, heap.stats() returns:
{
   // heap size on instantiation
  "initial": 4.50,

  // heap size now
  "current": 21.30,

  // max. heap size reached
  "max": 32.00,

   // diff. of initial and current, expressed as %
  "increasePercentage": 2.4,

   // collected stats of each garbage collection
  "snapshots": [V8HeapStats, V8HeapStats ...]
}
sizes are in megabytes (MB).
A V8HeapStats object contains garbage collection statistics as captured by
v8.getHeapStatistics().
For more info about garbage collection in V8, read here.
In Mocha, you can pass the test context like so:
Heapstats({ test: this })
the plot will auto-draw next to its test - but only if the test fails.
describe('#addTwoNumbers() - memory profiling', function() {

  beforeEach(async function() {
    this.heap = Heapstats({ test: this }) // pass `test: this`

    for (let i = 0; i < 200; i++)
      this.heap.sample(() => addTwoNumbers(2, 3))
  })

  it ('does not leak memory', function() {
    expect(this.heap.stats().current).to.be.below(10)
  })

  it ('does not exceed 100 MB in memory usage', function() {
    expect(this.heap.stats().max).to.be.below(100)
  })

  it ('has not increased by more than 2%', function() {
    expect(this.heap.stats().increasePercentage).to.be.below(2)
  })

  // ... and so on ...
})
[!IMPORTANT]
Avoid arrow functions/lambdas in Mochadescribe/itcallbacks, otherwisethiswould be lexically bound to the wrong value. Mocha itself heavily discourages their use.
To observe realtime heap statistics:
import Heapstats from 'heapstats'
and start with flag --heapstats, i.e:
node app.js --heapstats
const heap = new Heapstats({
  // plot size
  window: { columns: 100, rows: 25 },

  // test context, if used with mocha
  test: this,

  // draw plot if test ends in:
  plotOnTest: ['passed', 'failed']
})
npm i
then:
npm test
To run a specific test in isolation, i.e stats.spec.js:
npx mocha test/stats.spec.js --no-package --global leak
Modern GC's don't have concrete rules on when to run and how to run.
Their method of operation is intentionally abstracted from the user (you)
for a good reason so messing with it when testing is almost certain to make
your unit tests brittle and flaky.
I only wrote this because I needed a visual way to triage unit-tests when I was messing with Streams, which have explicit resource acquisition and release steps.
Garbage Collectors won't run if you're using (or abusing) small-ish amounts of memory regardless if whatever you're doing is actually causing a leak.
In these cases you'll see a flatlined plot and a low number of
heap.stats().snapshots.length.
There's always a bit of a weird dilemma in figuring out if there's no leak or if the GC has simply not kicked in yet.
The best way to go about it is to setup your test in a way that really
stresses the function under test and wait for a cycle. This means you
should run your function n amount of times, not just once. The n here
can easily mean tens of thousands or even millions of iterations.
If your function is expected to use some memory, the GC will have to eventually kick in to deallocate it - there's no other way to manually deallocate memory in the language.
If you're not seeing a cycle being logged and you're impatient about the whole
thing, you can always just force the GC to run by calling global.gc().
I've never seen a real memory leak where memory usage increases monotonically and linearly until it eventually runs out of memory.
A real memory leak, the kind that could happen in your actual production system, will usually present itself in a "seesaw" pattern.
This means a GC cycle takes place, memory usage drops - but it just doesn't quite drop entirely back to baseline.
There's always just a little bit extra being held after each cycle.
It's only when you project this effect over an extended period of time that you can clearly tell that it's a leak.
Don't rely on the results of just 1 cycle.
© 2024 Nicholas Kyriakides
The MIT No Attribution License
Permission is hereby granted, free of charge, to any person obtaining a copy of this software and associated documentation files (the "Software"), to deal in the Software without restriction, including without limitation the rights to use, copy, modify, merge, publish, distribute, sublicense, and/or sell copies of the Software, and to permit persons to whom the Software is furnished to do so.
FAQs
terminal-based heap allocation plotter
We found that heapstats demonstrated a healthy version release cadence and project activity because the last version was released less than a year ago. It has 0 open source maintainers collaborating on the project.
Did you know?

Socket for GitHub automatically highlights issues in each pull request and monitors the health of all your open source dependencies. Discover the contents of your packages and block harmful activity before you install or update your dependencies.
Product
Ensure open-source compliance with Socket’s License Enforcement Beta. Set up your License Policy and secure your software!
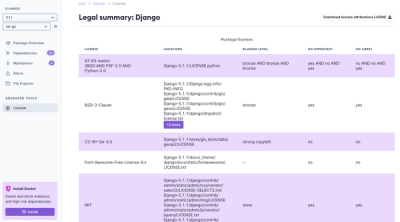
Product
We're launching a new set of license analysis and compliance features for analyzing, managing, and complying with licenses across a range of supported languages and ecosystems.
Product
We're excited to introduce Socket Optimize, a powerful CLI command to secure open source dependencies with tested, optimized package overrides.