Security News
/Research
Wallet-Draining npm Package Impersonates Nodemailer to Hijack Crypto Transactions
Malicious npm package impersonates Nodemailer and drains wallets by hijacking crypto transactions across multiple blockchains.
jvectormap-next
Advanced tools
jQuery plugin for embedding vector maps with reach API and methods for data visualization to the web-pages.
jVectorMap is a vector-based, cross-browser and cross-platform component for interactive geography-related data visualization on the web. It provides numerious features like smooth zooming and panning, fully-customizable styling, markers, labels and tooltips.
You can find maps, documentation, examples and more at the official site
var $ = require('jquery');
var $mountNode = $('[data-preview="jvectormap-next"] [data-testid="mountNode"]');
$mountNode.empty().css('height', 500);
// load jvectormap jquery plugin + map content
require('jvectormap-next')($);
$.fn.vectorMap('addMap', 'world_mill', require('jvectormap-content/world-mill'));
// render the map
var gdpData = {
'AF': 16.63,
'AL': 11.58,
'DZ': 158.97,
// ...
}
$mountNode.vectorMap({
map: 'world_mill',
series: {
regions: [{
values: gdpData,
scale: ['#C8EEFF', '#0071A4'],
normalizeFunction: 'polynomial'
}]
},
onRegionTipShow: function(e, el, code){
el.html(el.html()+' (GDP - '+gdpData[code]+')');
}
});
// this is needed for the storybook to work properly
false
FAQs
jQuery plugin for embedding vector maps with reach API and methods for data visualization to the web-pages.
The npm package jvectormap-next receives a total of 17,308 weekly downloads. As such, jvectormap-next popularity was classified as popular.
We found that jvectormap-next demonstrated a healthy version release cadence and project activity because the last version was released less than a year ago. It has 1 open source maintainer collaborating on the project.
Did you know?

Socket for GitHub automatically highlights issues in each pull request and monitors the health of all your open source dependencies. Discover the contents of your packages and block harmful activity before you install or update your dependencies.

Security News
/Research
Malicious npm package impersonates Nodemailer and drains wallets by hijacking crypto transactions across multiple blockchains.

Security News
This episode explores the hard problem of reachability analysis, from static analysis limits to handling dynamic languages and massive dependency trees.

Security News
/Research
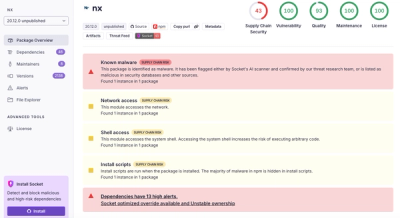
Malicious Nx npm versions stole secrets and wallet info using AI CLI tools; Socket’s AI scanner detected the supply chain attack and flagged the malware.