Product
Socket for Jira Is Now Available
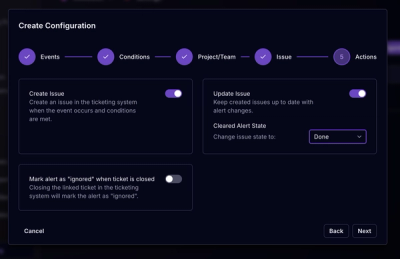
Socket for Jira lets teams turn alerts into Jira tickets with manual creation, automated ticketing rules, and two-way sync.
By Jeppe Hasseriis - Apr 20, 2026
leaflet-draw
Advanced tools
![]()
![]()

![]()


![]()
Adds support for drawing and editing vectors and markers on Leaflet maps.
Supports Leaflet 0.7.x and 1.0.0+ branches.
Please check out our Api Documentation
Leaflet.draw 0.2.0 changes a LOT of things from 0.1. Please see BREAKING CHANGES for how to upgrade.
Leaflet.draw uses the L.drawLocal configuration object to set any text used in the plugin. Customizing this will allow support for changing the text or supporting another language.
See Leaflet.draw.js for the default strings.
E.g.
    // Set the button title text for the polygon button
    L.drawLocal.draw.toolbar.buttons.polygon = 'Draw a sexy polygon!';

    // Set the tooltip start text for the rectangle
    L.drawLocal.draw.handlers.rectangle.tooltip.start = 'Not telling...';
The following examples outline some common tasks.
The following example will show you how to:
    var cloudmadeUrl = 'http://{s}.tile.cloudmade.com/BC9A493B41014CAABB98F0471D759707/997/256/{z}/{x}/{y}.png',
        cloudmade = new L.TileLayer(cloudmadeUrl, {maxZoom: 18}),
        map = new L.Map('map', {layers: [cloudmade], center: new L.LatLng(-37.7772, 175.2756), zoom: 15 });

    var editableLayers = new L.FeatureGroup();
    map.addLayer(editableLayers);

    var MyCustomMarker = L.Icon.extend({
        options: {
            shadowUrl: null,
            iconAnchor: new L.Point(12, 12),
            iconSize: new L.Point(24, 24),
            iconUrl: 'link/to/image.png'
        }
    });

    var options = {
        position: 'topright',
        draw: {
            polyline: {
                shapeOptions: {
                    color: '#f357a1',
                    weight: 10
                }
            },
            polygon: {
                allowIntersection: false, // Restricts shapes to simple polygons
                drawError: {
                    color: '#e1e100', // Color the shape will turn when intersects
                    message: '<strong>Oh snap!<strong> you can\'t draw that!' // Message that will show when intersect
                },
                shapeOptions: {
                    color: '#bada55'
                }
            },
            circle: false, // Turns off this drawing tool
            rectangle: {
                shapeOptions: {
                    clickable: false
                }
            },
            marker: {
                icon: new MyCustomMarker()
            }
        },
        edit: {
            featureGroup: editableLayers, //REQUIRED!!
            remove: false
        }
    };

    var drawControl = new L.Control.Draw(options);
    map.addControl(drawControl);

    map.on(L.Draw.Event.CREATED, function (e) {
        var type = e.layerType,
            layer = e.layer;

        if (type === 'marker') {
            layer.bindPopup('A popup!');
        }

        editableLayers.addLayer(layer);
    });
You can change a draw handlers options after initialisation by using the setDrawingOptions method on the Leaflet.draw control.
E.g. to change the colour of the rectangle:
drawControl.setDrawingOptions({
    rectangle: {
    	shapeOptions: {
        	color: '#0000FF'
        }
    }
});
To test you can install the npm dependencies:
npm install
and then use:
jake test
Documentation is build with Leafdoc, to generate the documentation use
jake docs
and the generated html documentation is saved to ./docs/leaflet-draw-latest.html
Touch friendly version of Leaflet.draw was created by Michael Guild (https://github.com/michaelguild13).
The touch support was initiated due to a demand for it at National Geographic for their Map Maker Projected (http://mapmaker.education.nationalgeographic.com/) that was created by Michael Guild and Daniel Schep (https://github.com/dschep)
Thanks so much to @brunob, @tnightingale, and @shramov. I got a lot of ideas from their Leaflet plugins.
All the contributors and issue reporters of this plugin rock. Thanks for tidying up my mess and keeping the plugin on track.
The icons used for some of the toolbar buttons are either from http://glyphicons.com/ or inspired by them. <3 Glyphicons!
Finally, @mourner is the man! Thanks for dedicating so much of your time to create the gosh darn best JavaScript mapping library around.
Leaflet.pm is a popular Leaflet plugin that provides similar functionalities to leaflet-draw, including drawing, editing, and deleting shapes on a map. It offers a more modern and actively maintained alternative with additional features like snapping, cutting, and rotating shapes.
Leaflet-Path-Drag is a Leaflet plugin that allows users to drag and edit polylines and polygons on a map. While it does not provide the full range of drawing tools available in leaflet-draw, it is useful for applications that require simple shape editing capabilities.
FAQs
Vector drawing plugin for Leaflet
The npm package leaflet-draw receives a total of 275,488 weekly downloads. As such, leaflet-draw popularity was classified as popular.
We found that leaflet-draw demonstrated a not healthy version release cadence and project activity because the last version was released a year ago. It has 2 open source maintainers collaborating on the project.
Did you know?

Socket for GitHub automatically highlights issues in each pull request and monitors the health of all your open source dependencies. Discover the contents of your packages and block harmful activity before you install or update your dependencies.
Product
Socket for Jira lets teams turn alerts into Jira tickets with manual creation, automated ticketing rules, and two-way sync.

Company News
Socket won two 2026 Reppy Awards from RepVue, ranking in the top 5% of all sales orgs. AE Alexandra Lister shares what it's like to grow a sales career here.

Security News
NIST will stop enriching most CVEs under a new risk-based model, narrowing the NVD's scope as vulnerability submissions continue to surge.