
Research
/Security News
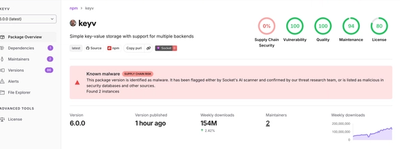
Popular npm Packages in the keyv and Cacheable Namespaces Compromised in Active Supply Chain Attack
Popular npm packages keyv and cacheable compromised.
By Socket Research Team - Aug 04, 2026
mathgraphs-mcp
Advanced tools
MCP server for interactive math graphing, 3D scene building, and presentations
MCP server for interactive math graphing, 3D scene building, and presentations.
MathTalking computes and renders interactive visualizations. Plot 2D functions, geometry, and 3D scenes. Results are graph-verified — roots, extrema, and intersections are computed from actual plotted curves, not generated by AI.
Zero install. Browser-native. Every result is a shareable interactive URL.
Settings → Connectors → Add custom connector → paste:
https://mathtalking.com/api/mcp
No account or API key needed.
claude mcp add --transport http mathtalking https://mathtalking.com/api/mcp
POST https://mathtalking.com/api/mcp
Content-Type: application/json
Standard JSON-RPC 2.0 over Streamable HTTP.
plot_graph — 2D Math VisualizationPlot functions, points, segments, labels, and shapes on an interactive graph. Auto-computes roots, extrema, and intersections for plotted functions.
Input: Array of elements, each with a type and type-specific fields:
| Type | Fields | Example |
|---|---|---|
function | expression (required), color | {"type":"function", "expression":"x^2-4", "color":"#4A90D9"} |
points | points [{x,y}] (required), color, label | {"type":"points", "points":[{"x":2,"y":0}], "label":"root"} |
segment | x1,y1,x2,y2 (required), color, label, arrow, dashed | {"type":"segment", "x1":0, "y1":0, "x2":3, "y2":4, "label":"hypotenuse"} |
label | text (required), x,y (required), color, fontSize | {"type":"label", "text":"vertex", "x":0, "y":-4} |
triangle | x1,y1,x2,y2,x3,y3 (required), color, opacity, border | {"type":"triangle", "x1":0, "y1":0, "x2":3, "y2":0, "x3":3, "y3":4} |
box | x1,y1,x2,y2 (required), height (required), color, opacity | {"type":"box", "x1":0, "y1":0, "x2":1, "y2":0, "height":5} |
circle | cx,cy,radius (required), color, opacity, border | {"type":"circle", "cx":0, "cy":0, "radius":3} |
Supports: Explicit y=f(x), implicit x²+y²=1, parametric (cos(t),sin(t)), polar, piecewise, domain restrictions.
Optional params:
viewport — {xmin, xmax, ymin, ymax} to set coordinate rangetitle — graph titlesummary — frosted glass overlay text on the graphgridStyle — "polar" (concentric circles + radial lines), "axes" (axes only), "none" (clean canvas)output — "url" (default, interactive page), "embed" (iframe URL), or "svg" (vector image)animations — array of {tool, name, from, to, loop} for animated parameterstheme — "default", "terminal", "wallstreet", "science", or "finance"Returns: Interactive URL with zoom, pan, and sliders. Auto-computed roots, extrema, and intersections in the response text.
plot_3d — 3D Scene BuilderCreate interactive 3D scenes with shapes, lights, and particle effects. Build anything — snowmen, castles, robots, geometry.
Input: Array of elements, each with a type and type-specific fields:
| Type | Fields | Example |
|---|---|---|
mesh | shape (required), color, opacity, position, rotation, metalness, roughness, wireframe | {"type":"mesh", "shape":"sphere", "r":1, "metalness":0.8, "position":[0,1,0]} |
compound | compound (required), position, scale, color | {"type":"compound", "compound":"house", "color":"#cc2222", "position":[0,0,0]} |
surface | expression (required), color, xmin, xmax, ymin, ymax, resolution | {"type":"surface", "expression":"sin(x)*cos(y)", "color":"#4A90D9"} |
light | kind (point/spot/directional), color, intensity, position | {"type":"light", "kind":"point", "color":"#ff8800", "position":[0,5,0]} |
particle | preset (fire/smoke/rain/snow/sparkle/mist/splash), position, count, spread | {"type":"particle", "preset":"fire", "position":[3,0,0]} |
water | position, size, waveHeight, color, opacity | {"type":"water", "position":[0,0,0], "size":10} |
line3d | from [x,y,z], to [x,y,z], color | {"type":"line3d", "from":[0,0,0], "to":[1,1,1]} |
label3d | text, position [x,y,z] | {"type":"label3d", "text":"origin", "position":[0,0,0]} |
text3d | text, position [x,y,z], color, fontSize | {"type":"text3d", "text":"HELLO", "position":[0,2,0], "color":"#ff0000", "fontSize":1} |
11 mesh shapes: cube, box, sphere, cylinder, cone, tetrahedron, octahedron, dodecahedron, icosahedron, torus, prism
36 compound presets: tree, house, castle_tower, fence, campfire, rock, stairs, arch, table, chair, person, car, road_sign, windmill, dog, cat, flag, bed, sofa, bookshelf, lamp, desk, bush, flower, bridge, lamp_post, bench, apartment, skyscraper, shopping_center, hospital, ambulance, truck, boat, traffic_light, water_tower, fountain
Color-driven building styles: Buildings change architectural style based on color — red=Chinese, blue=modern, yellow=cozy, green=eco, brown=rustic. The actual hex color is used for materials; the hue just selects the geometry variant.
Shape params: cube→size, box→width/height/depth, sphere→r, cylinder→r/h, cone→r/h, torus→r/tube, prism→points/h
Material params: metalness (0=plastic, 1=chrome), roughness (0=mirror, 1=matte), wireframe (boolean)
Animation: animate: {type, speed, ...} — spin, bounce, orbit, waypoint, follow (tracks player)
Physics & controls: physics: {velocity, mass}, controls: {type:"wasd", speed}, collision: true
Incremental building:
base_render_id — build on an existing scene (appends elements, creates new URL)remove_indices — remove elements by index from base (use get_3d to see indices)Optional: title, summary, camera {position, target}, skybox (day/sunset/night/overcast), gravity (-9.8), follow (boolean)
Returns: Interactive 3D URL with orbit controls + inline PNG thumbnail for chat preview.
get_3d — Inspect 3D SceneRetrieve the full element list of an existing 3D render by ID. Use this before base_render_id to see what a scene contains and plan modifications.
Input: render_id (the short alphanumeric ID from the URL)
Returns: All elements with their properties (shapes, positions, colors, materials).
create_show — Slideshow PresentationsBundle multiple plot_graph results into a slideshow. Create each slide with plot_graph first, then pass the render IDs here.
Input: title (string), slide_ids (array of render IDs from plot_graph results), summary (optional per-slide text).
Returns: Interactive show URL with prev/next navigation, keyboard controls, and auto-play.
# 2D graph
curl -X POST https://mathtalking.com/api/mcp \
  -H 'Content-Type: application/json' \
  -d '{"jsonrpc":"2.0","id":1,"method":"tools/call","params":{"name":"plot_graph","arguments":{"elements":[{"type":"function","expression":"sin(x)","color":"#4A90D9"}]}}}'

# 3D scene
curl -X POST https://mathtalking.com/api/mcp \
  -H 'Content-Type: application/json' \
  -d '{"jsonrpc":"2.0","id":1,"method":"tools/call","params":{"name":"plot_3d","arguments":{"elements":[{"type":"mesh","shape":"sphere","r":1,"color":"#ff0000","position":[0,1,0]}]}}}'
FAQs
MCP server for interactive math graphing, 3D scene building, and presentations
We found that mathgraphs-mcp demonstrated a healthy version release cadence and project activity because the last version was released less than a year ago. It has 1 open source maintainer collaborating on the project.
Did you know?

Socket for GitHub automatically highlights issues in each pull request and monitors the health of all your open source dependencies. Discover the contents of your packages and block harmful activity before you install or update your dependencies.
Research
/Security News
Popular npm packages keyv and cacheable compromised.

Security News
A misconfiguration gave three Anthropic models internet access, and one, believing it was in a simulation, shipped a credential-stealing package to PyPI.

Security News
/Company News
Socket has joined the new Composer and Packagist sponsorship program as a launch sponsor, supporting the team that keeps PHP's package ecosystem secure.