node-red-contrib-dashboard-bar-chart-data
Bar-chart-data

This node transforms msg.payload, attaches (and stores) past values and build a message that could be linked to the ui_chart node configured as "bar chart".
It can handle measurements (e.g. current power consumption) or meter readings (e.g. gas/water/energy meter count) and calculate the sum, min, max or average in a customizable time range.
Works with multiple topics, too.
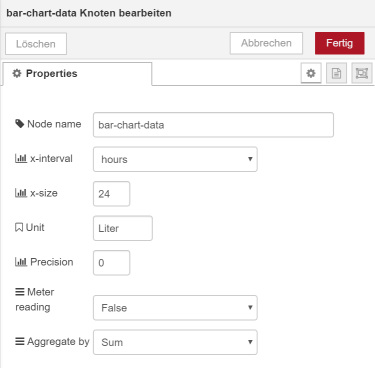
Properties :
- Name
- The name of this node
- x-interval
- 1 bar per:
- second
- minute
- quarter-hour
- hour
- day
- year
- x-size
- How many bars should be displayed. Example: x-interval=hours, x-size=24 : 24 bars, each 1 hour. That means that the last 24 hours will be displayed
- Unit
- The unit of the payload, will be displayed in the bar-chart
- Precision
- Number of decimals
- Meter reading
- Set this to "True" if msg.payload is a meter reading, so that this node will use the difference of the current and last value.
- True: msg.payload is meter reading, like the total energy, gas or water meter value or operating hours
- False: msg.payload is a measurement, like power (watt), pressure or temperature
- Aggregate by
-
- sum: sum all values in x-interval
- min: just display the smallest value in x-interval
- max: just display the largest value in x-interval
- avg: average value in x-interval
- Screenshot
-
Clear and Restore
- A message with the payload "clear" and the same topic like the sensor will reset the data for this specific sensor only.
A message with the payload "clear" without a topic (empty string) will delete all data, so that the chart will be blank again.
If you put the output of this node to the input of this node (via persist node), the data will be restored.
This could be helpful to avoid getting a blank bar-chart after node-red has been restarted (reboot).
Additional output: Sum, Min, Max, Settings
- This is included in the output message (and could be used to set chart title etc.):
- The node settings (unit, x_interval, x_size, precision, is_meter_reading, agg_by) as json in
msg.settings
- The smallest value of all bars (min) in
msg.min
- The largest value of all bars (max) in
msg.max
- The sum of all bars in
msg.sum
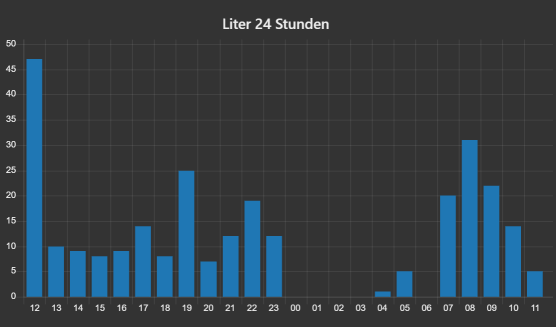
Sample Result
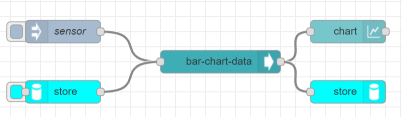
Sample Flow
[{"id":"307f07f.8b8c1f8","type":"bar-chart-data","z":"3b18da32.bba756","name":"bar-chart-data","x_interval":"seconds","x_size":"24","unit":"Liter","precision":"0","is_meter_reading":"False","agg_by":"sum","x":340,"y":140,"wires":[["11edb254.d31a6e","3e6bc8b7.f4bc88"]]},{"id":"11edb254.d31a6e","type":"ui_chart","z":"3b18da32.bba756","name":"","group":"c716d8f1.4bb848","order":3,"width":"12","height":"4","label":"Liter letzte {{msg.settings.x_size}} Sekunden {{msg.data_sum}}","chartType":"bar","legend":"false","xformat":"HH:mm:ss","interpolate":"linear","nodata":"","dot":false,"ymin":"","ymax":"","removeOlder":"30","removeOlderPoints":"","removeOlderUnit":"60","cutout":0,"useOneColor":true,"colors":["#1f77b4","#aec7e8","#ff7f0e","#2ca02c","#98df8a","#d62728","#ff9896","#9467bd","#c5b0d5"],"useOldStyle":false,"outputs":1,"x":510,"y":100,"wires":[[]]},{"id":"3e6bc8b7.f4bc88","type":"persist in","z":"3b18da32.bba756","name":"store","storageNode":"e0e7ea5c.056af8","x":510,"y":180,"wires":[]},{"id":"8343e961.cbf7e8","type":"inject","z":"3b18da32.bba756","name":"sensor","topic":"devices/homie-har/water/liter","payload":"1","payloadType":"num","repeat":"","crontab":"","once":false,"onceDelay":0.1,"x":130,"y":100,"wires":[["307f07f.8b8c1f8"]]},{"id":"29a85329.d6b03c","type":"persist out","z":"3b18da32.bba756","name":"store","storageNode":"e0e7ea5c.056af8","x":130,"y":180,"wires":[["307f07f.8b8c1f8"]]},{"id":"c716d8f1.4bb848","type":"ui_group","z":"","name":"bar-chart","tab":"957fd14a.a1277","disp":true,"width":"12","collapse":false},{"id":"e0e7ea5c.056af8","type":"persist-store","z":"","filename":"~/store.json","interval":"60"},{"id":"957fd14a.a1277","type":"ui_tab","z":"","name":"bar-chart","icon":"dashboard","disabled":false,"hidden":false}]