Product
Socket Now Protects the Chrome Extension Ecosystem
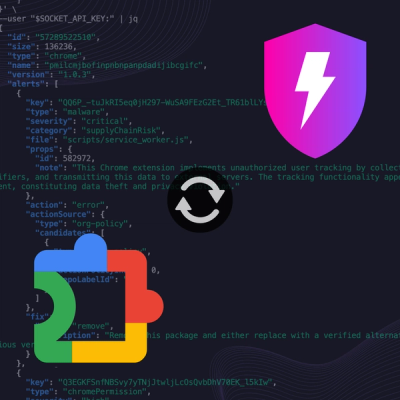
Socket is launching experimental protection for Chrome extensions, scanning for malware and risky permissions to prevent silent supply chain attacks.
perf-deets
Advanced tools
Super rough right now, but this a library for profiling in user-space. It provides two pieces: a backend API used to collect data, and a frontend for displaying that data. You don't have to use this frontend, but you can listen to events and display the d
Super rough right now, but this a library for profiling in user-space. It provides two pieces: a backend API used to collect data, and a frontend for displaying that data. You don't have to use this frontend, but you can listen to events and display the data yourself.
This API will change, this is just a proof of concept.
This is meant to help you understand more complex situations like:
First, setup a frontend to display the data:
import { listenForPerfData } from 'perf-deets/frontend';
listenForPerfData(window);
Now, collect the data like this:
import * as perf from 'perf-deets';

perf.start();

for(let i=0; i<1000; i++) {
  perf.record('render');

  // Do something heavy

  perf.endRecording('render');
}

perf.stop()
This will collect many different timing for the heavy work. When the data is ready, a "Perf results are ready!" notification will pop up in the top right of the screen. Clicking "display" will visualize the results.
This fully supports workers. If you want to record data from workers, do this:
let worker = new Worker(...);
listenForPerfData(worker);

worker.postMessage({ type: '__perf-deets:start-profile' });
// Tell the worker to do some work
worker.postMessage({ type: '__perf-deets:stop-profile' });
Inside the worker, import perf-deets and record data normally. The same "perf results are ready" notification will pop up.
FAQs
Super rough right now, but this a library for profiling in user-space. It provides two pieces: a backend API used to collect data, and a frontend for displaying that data. You don't have to use this frontend, but you can listen to events and display the d
We found that perf-deets demonstrated a not healthy version release cadence and project activity because the last version was released a year ago. It has 1 open source maintainer collaborating on the project.
Did you know?

Socket for GitHub automatically highlights issues in each pull request and monitors the health of all your open source dependencies. Discover the contents of your packages and block harmful activity before you install or update your dependencies.

Product
Socket is launching experimental protection for Chrome extensions, scanning for malware and risky permissions to prevent silent supply chain attacks.

Product
Add secure dependency scanning to Claude Desktop with Socket MCP, a one-click extension that keeps your coding conversations safe from malicious packages.

Product
Socket now supports Scala and Kotlin, bringing AI-powered threat detection to JVM projects with easy manifest generation and fast, accurate scans.