Product
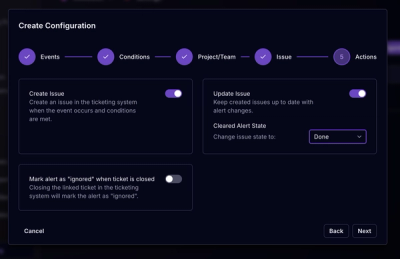
Socket for Jira Is Now Available
Socket for Jira lets teams turn alerts into Jira tickets with manual creation, automated ticketing rules, and two-way sync.
Unitech/PM2 performance monioring using Statsd and Graphite
$ npm install pm2-ant -g
$ pm2-ant <cmd> [options]
# or
$ npm install pm2-ant --production
$ cd node_modules/pm2-ant
# or
$ git clone https://github.com/Tjatse/pm2-ant.git
$ cd pm2-ant
$ npm install --production
$ pm2-ant <cmd> [options]
I'm using PM2 to run thousands applications on dozens of servers, the performance of PM2 (maybe applications) is hard to track on production environment, e.g.:

When the carbon and statsd are both running, just edit the pm2-ant.ini file to make everything goes fine, then use the following commands to get usage helps:
$ pm2-ant
Directly:
$ node pm2-ant.js
Programmable:
var pm2Ant = require('pm2-ant');
pm2Ant.start([options]);
Now you can view matrices with Grafana.

statsD path:
stats.gauges.pm2.<node_name>.<app_name>.planned_restart_count
stats.gauges.pm2.<node_name>.<app_name>.<pm_id>.planned_restart_count
stats.gauges.pm2.<node_name>.<app_name>.unstable_restart_count
stats.gauges.pm2.<node_name>.<app_name>.<pm_id>.unstable_restart_count
stats.pm2.<node_name>.<app_name>.event.<event_name>
stats.pm2.<node_name>.<app_name>.<pm_id>.event.<event_name>
stats.timers.pm2.<node_name>.<app_name>.uptime
stats.timers.pm2.<node_name>.<app_name>.<pm_id>.uptime
./pm2-ant.ini defaults:
node = LocalPM2
pm2 = ~/.pm2
refresh = 5000
statsd = 127.0.0.1:8125
daemonize = true

[log]
dir = ./logs
prefix = true
date = false
level = debug
Licensed under the Apache License, Version 2.0 (the "License"); you may not use this file except in compliance with the License. You may obtain a copy of the License at
http://www.apache.org/licenses/LICENSE-2.0
Unless required by applicable law or agreed to in writing, software distributed under the License is distributed on an "AS IS" BASIS, WITHOUT WARRANTIES OR CONDITIONS OF ANY KIND, either express or implied. See the License for the specific language governing permissions and limitations under the License.
FAQs
Unitech/PM2 performance monioring using Statsd and Graphite
The npm package pm2-ant receives a total of 11 weekly downloads. As such, pm2-ant popularity was classified as not popular.
We found that pm2-ant demonstrated a not healthy version release cadence and project activity because the last version was released a year ago. It has 1 open source maintainer collaborating on the project.
Did you know?

Socket for GitHub automatically highlights issues in each pull request and monitors the health of all your open source dependencies. Discover the contents of your packages and block harmful activity before you install or update your dependencies.

Product
Socket for Jira lets teams turn alerts into Jira tickets with manual creation, automated ticketing rules, and two-way sync.

Company News
Socket won two 2026 Reppy Awards from RepVue, ranking in the top 5% of all sales orgs. AE Alexandra Lister shares what it's like to grow a sales career here.

Security News
NIST will stop enriching most CVEs under a new risk-based model, narrowing the NVD's scope as vulnerability submissions continue to surge.