

Company News
AWS Security Hub Adds Socket for Supply Chain Security
Socket is now in the AWS Security Hub Extended plan. Adopt it through AWS, apply committed spend, and block malicious open source packages.
By Feross Aboukhadijeh - Aug 04, 2026
postgres-scout-mcp
Advanced tools
Scout your PostgreSQL databases with AI - A production-ready MCP server with safety features, monitoring, and data quality tools
Scout your PostgreSQL databases with AI - A production-ready Model Context Protocol server with built-in safety features, monitoring, and data quality tools.


You ask:
"How healthy is my production database? Any urgent issues?"
Postgres Scout returns:
Component Breakdown
| Component | Score | Status |
|---|---|---|
| Cache Performance | 94/100 | Healthy |
| Index Efficiency | 82/100 | Good |
| Table Bloat | 61/100 | Needs Attention |
| Connection Usage | 75/100 | Fair |
Issues Found
orders has 34% bloat (2.1 GB wasted). VACUUM FULL recommended.sessions consuming 890 MB.analytics_events is 71% (target: >90%).Recommendations
VACUUM FULL orders during maintenance windowidx_sessions_legacy, idx_sessions_old_token, idx_sessions_tempanalytics_events to shared_buffers or partitioning by dateThat's getHealthScore — one of 38 tools covering exploration, diagnostics, optimization, monitoring, data quality, and safe writes.
claude mcp add postgres-scout -- npx -y postgres-scout-mcp postgresql://localhost:5432/mydb
Then ask: "Show me the largest tables and whether they have any bloat issues."
Add to your Claude Desktop config (~/Library/Application Support/Claude/claude_desktop_config.json on macOS):
{
  "mcpServers": {
    "postgres-scout": {
      "command": "npx",
      "args": ["-y", "postgres-scout-mcp", "postgresql://localhost:5432/mydb"],
      "type": "stdio"
    }
  }
}
Add to your MCP settings:
{
  "postgres-scout": {
    "command": "npx",
    "args": ["-y", "postgres-scout-mcp", "postgresql://localhost:5432/mydb"]
  }
}
The server runs in read-only mode by default. For write operations, run a separate instance:
{
  "mcpServers": {
    "postgres-scout-readonly": {
      "command": "npx",
      "args": ["-y", "postgres-scout-mcp", "--read-only", "postgresql://localhost:5432/production"],
      "type": "stdio"
    },
    "postgres-scout-readwrite": {
      "command": "npx",
      "args": ["-y", "postgres-scout-mcp", "--read-write", "postgresql://localhost:5432/development"],
      "type": "stdio"
    }
  }
}
listDatabases — databases the user has access togetDatabaseStats — size, cache hit ratio, connection infolistSchemas — all schemas in the current databaselistTables — tables with size and row statisticsdescribeTable — columns, constraints, indexes, and moreexecuteQuery — run SELECT queries (or writes in read-write mode)explainQuery — EXPLAIN plans for performance analysisoptimizeQuery — optimization recommendations for a specific querygetHealthScore — overall health score with component breakdowndetectAnomalies — anomalies in performance, connections, and dataanalyzeTableBloat — bloat analysis for VACUUM planninggetSlowQueries — slow query analysis (requires pg_stat_statements)suggestVacuum — VACUUM recommendations based on dead tuples and bloatsuggestIndexes — missing index recommendations from query patternssuggestPartitioning — partitioning strategies for large tablesgetIndexUsage — identify unused or underused indexesgetCurrentActivity — active queries and connectionsanalyzeLocks — lock contention and blocking queriesgetLiveMetrics — real-time metrics over a time windowgetHottestTables — tables with highest activitygetTableMetrics — comprehensive per-table I/O and scan statsfindDuplicates — duplicate rows by column combinationfindMissingValues — NULL analysis across columnsfindOrphans — orphaned records with invalid foreign keyscheckConstraintViolations — test constraints before adding themanalyzeTypeConsistency — type inconsistencies in text columnsexploreRelationships — multi-hop foreign key traversalanalyzeForeignKeys — foreign key health and performancefindRecent — rows within a time windowanalyzeTimeSeries — window functions and anomaly detectiondetectSeasonality — seasonal pattern detectionexportTable — CSV, JSON, JSONL, or SQLgenerateInsertStatements — INSERT statements for migrationpreviewUpdate / previewDelete — see what would change before committingsafeUpdate — UPDATE with dry-run, row limits, empty WHERE protectionsafeDelete — DELETE with dry-run, row limits, empty WHERE protectionsafeInsert — INSERT with validation, batching, ON CONFLICT support"What are the largest tables and do they have bloat?"
listTables({ schema: "public" })
analyzeTableBloat({ schema: "public", minSizeMb: 100 })
"Find duplicate emails in the users table."
findDuplicates({ table: "users", columns: ["email"] })
"Which queries are slowest and how can I speed them up?"
getSlowQueries({ minDurationMs: 100, limit: 10 })
suggestIndexes({ schema: "public" })
"Show me what's happening on the database right now."
getCurrentActivity()
getLiveMetrics({ metrics: ["queries", "connections", "cache"], duration: 30000, interval: 1000 })
getHottestTables({ limit: 5, orderBy: "seq_scan" })
"Find orphaned orders that reference deleted customers."
findOrphans({ table: "orders", foreignKey: "customer_id", referenceTable: "customers", referenceColumn: "id" })
| Variable | Default | Description |
|---|---|---|
QUERY_TIMEOUT | 30000 | Query timeout in milliseconds |
MAX_RESULT_ROWS | 10000 | Maximum rows returned per query |
ENABLE_RATE_LIMIT | true | Enable rate limiting |
RATE_LIMIT_MAX_REQUESTS | 100 | Requests per window |
RATE_LIMIT_WINDOW_MS | 60000 | Rate limit window (ms) |
PGMAXPOOLSIZE | 10 | Connection pool max size |
PGMINPOOLSIZE | 2 | Connection pool min size |
PGIDLETIMEOUT | 10000 | Idle connection timeout (ms) |
ENABLE_LOGGING | false | Enable file logging |
LOG_DIR | ./logs | Log file directory |
LOG_LEVEL | info | Log verbosity: debug, info, warn, error |
CLI flags: --read-only (default), --read-write, --mode <mode>
File logging is disabled by default. Set ENABLE_LOGGING=true to enable. Two log files are created in LOG_DIR:
Connection strings are automatically redacted in all output.
git clone https://github.com/bluwork/postgres-scout-mcp.git
cd postgres-scout-mcp
pnpm install
pnpm build
pnpm test
Apache-2.0
FAQs
Scout your PostgreSQL databases with AI - A production-ready MCP server with safety features, monitoring, and data quality tools
We found that postgres-scout-mcp demonstrated a healthy version release cadence and project activity because the last version was released less than a year ago. It has 1 open source maintainer collaborating on the project.
Did you know?

Socket for GitHub automatically highlights issues in each pull request and monitors the health of all your open source dependencies. Discover the contents of your packages and block harmful activity before you install or update your dependencies.
Company News
Socket is now in the AWS Security Hub Extended plan. Adopt it through AWS, apply committed spend, and block malicious open source packages.
Research
/Security News
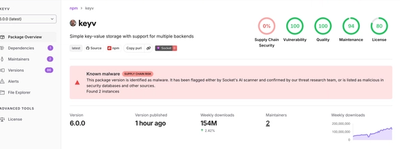
Popular npm packages keyv and cacheable compromised.

Security News
A misconfiguration gave three Anthropic models internet access, and one, believing it was in a simulation, shipped a credential-stealing package to PyPI.