speedscope
Advanced tools
speedscope - npm Package Compare versions
Comparing version 0.7.1 to 1.0.0
@@ -1,3 +0,7 @@ | ||
| ## [Unreleased] | ||
| ## [1.0.0] - 2018-08-23 | ||
| ### Fixed | ||
| * Fixed rendering issues when switching between screens w/ different `devicePixelRatios` [#147] | ||
| ## [0.7.1] - 2018-08-20 | ||
@@ -4,0 +8,0 @@ |
@@ -1,3 +0,3 @@ | ||
| speedscope@0.7.1 | ||
| Mon Aug 20 08:46:55 PDT 2018 | ||
| 03578ea7a47a32d5f5e7d57b72c8fb9dd6aac1d3 | ||
| speedscope@1.0.0 | ||
| Thu Aug 23 09:40:18 PDT 2018 | ||
| da2de64d97512b4a97dbd9f54914d00ca6bdd06a |
| { | ||
| "name": "speedscope", | ||
| "version": "0.7.1", | ||
| "version": "1.0.0", | ||
| "description": "", | ||
@@ -5,0 +5,0 @@ "repository": "jlfwong/speedscope", |
| # 🔬speedscope | ||
| A fast, interactive web-based viewer for [sampling profiles][0]. An alternative viewer for [FlameGraphs][1]. Will happily display multi-megabyte profiles without crashing your browser. | ||
| A fast, interactive web-based viewer for performance profiles. An alternative viewer for [FlameGraphs][1]. Will happily display multi-megabyte profiles without crashing your browser. | ||
@@ -16,2 +16,4 @@ Given raw profiling data, speedscope allows you to interactively explore the data to get insight into what's slow in your application, or allocating all the memory, or whatever data is represented in the profiling data. | ||
| ## Command line usage | ||
| For offline use, or convenience in the terminal, you can also install speedscope | ||
@@ -24,56 +26,27 @@ via npm: | ||
| ## Supported file formats | ||
| ## Self-contained directory | ||
| ### Chrome | ||
| If you don't have npm or node installed, you can also download a | ||
| self-contained version from https://github.com/jlfwong/speedscope/releases. | ||
| After you download the zip file from a release, simply unzip it and open the | ||
| contained `index.html` in Chrome or Firefox. | ||
| Both the timeline format output by Chrome developers tools (https://developers.google.com/web/tools/chrome-devtools/evaluate-performance/reference#save) and the `.cpuprofile` format output are supported. The `.cpuprofile` format is useful for viewing flamecharts generated by Node.js applications: | ||
| https://medium.com/@paul_irish/debugging-node-js-nightlies-with-chrome-devtools-7c4a1b95ae27 | ||
| ## Supported file formats | ||
| ### Firefox | ||
| speedscope is designed to ingest profiles from a variety of different profilers for different programming languages & environments. Click the links below for documentation on how to import from a specific source. | ||
| The `profile.json` file format output by Firefox can be saved and import into speedscope: https://developer.mozilla.org/en-US/docs/Tools/Performance | ||
| - JavaScript | ||
| - [Importing from Chrome](https://github.com/jlfwong/speedscope/wiki/Importing-from-Chrome) | ||
| - [Importing from Firefox](https://github.com/jlfwong/speedscope/wiki/Importing-from-Firefox) | ||
| - [Importing from Node.js](https://github.com/jlfwong/speedscope/wiki/Importing-from-Node.js) | ||
| - Ruby | ||
| - [Importing from stackprof](https://github.com/jlfwong/speedscope/wiki/Importing-from-stackprof-(ruby)) | ||
| - [Importing from rbspy](https://github.com/jlfwong/speedscope/wiki/Importing-from-rbspy-(ruby)) | ||
| - Native code | ||
| - [Importing from Instruments.app](https://github.com/jlfwong/speedscope/wiki/Importing-from-Instruments.app) (macOS) | ||
| - [Importing from `perf`](https://github.com/jlfwong/speedscope/wiki/Importing-from-perf-(linux)) (linux) | ||
| - [Importing from custom sources](https://github.com/jlfwong/speedscope/wiki/Importing-from-custom-sources) | ||
| ### Node | ||
| Contributions to add support for additional formats are welcome! See issues with the ["import source" tag](https://github.com/jlfwong/speedscope/issues?q=is%3Aissue+is%3Aopen+label%3A%22import+source%22). | ||
| If you record profiling information like so: | ||
| node --prof /path/to/my/script.js | ||
| Then this will generate one or more `isolate*.log` files. You can open | ||
| the resulting profile in speedscope by running the following command: | ||
| node --prof-process --preprocess -j isolate*.log | speedscope - | ||
| ### Instruments.app | ||
| You can import call trees from OSX Instruments.app into speedscope by | ||
| selecting a row in the "Profile" view and select "Edit -> Deep Copy" from the | ||
| menu then pasting directly into speedscope. This data contains only aggregate | ||
| statistics, so the "Time Order" view and the "Left Heavy" view will look very | ||
| similar. | ||
| You can also import `.trace` files for time profiles by dragging them directly | ||
| into the browser from Chrome. | ||
| ### `stackprof` Ruby profiler | ||
| If the `raw: true` flag is set when recording a dump, the resulting json dump can be imported into speedscope. | ||
| ### Linux `perf` | ||
| You can import profiles recorded using `perf record` and formatted using `perf script`. | ||
| perf record -a -F 999 -g -p PID > perf.data | ||
| perf script -i perf.data > profile.linux-perf.txt | ||
| Then drop the resulting `perf.txt` into speedscope, or if you have speedscope installed | ||
| locally, you can run: | ||
| perf record -a -F 999 -g -p PID > perf.data | ||
| perf script -i perf.data | speedscope - | ||
| ### `DTrace` | ||
| If you process the output of `DTrace` first with Brendan Gregg's `stackcollapse-*.pl` scripts (https://github.com/brendangregg/FlameGraph#2-fold-stacks), the result can be imported into speedscope. | ||
| ## Importing via URL | ||
@@ -86,12 +59,11 @@ | ||
| ### 🕰Time Order | ||
| 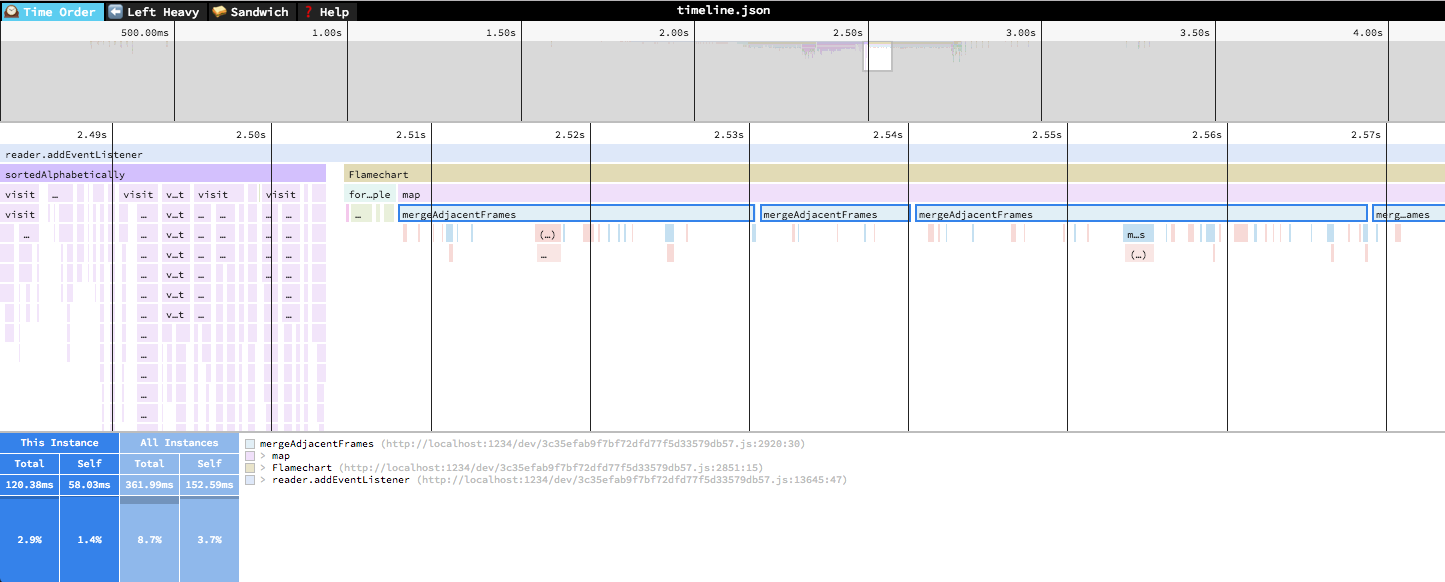 | ||
| In the "Time Order" view (the default), the stacks are ordered left-to-right in the same order as the occurred in the input file, which is usually going to be the chronological order they were recorded in. This view is most helpful for understand the behavior of an application over time, e.g. "first the data is fetched from the database, then the data is prepared for serialization, then the data is serialized to JSON". This is the only flame graph order supported by Chrome developer tools. | ||
| In the "Time Order" view (the default), call stacks are ordered left-to-right in the same order as they occurred in the input file, which is usually going to be the chronological order they were recorded in. This view is most helpful for understanding the behavior of an application over time, e.g. "first the data is fetched from the database, then the data is prepared for serialization, then the data is serialized to JSON". | ||
| In all flamegraph views, the horizontal axis represents the "weight" of each stack (most commonly CPU time), and the vertical axis shows you the stack active at the time of the sample. | ||
| The horizontal axis represents the "weight" of each stack (most commonly CPU time), and the vertical axis shows you the stack active at the time of the sample. If you click on one of the frames, you'll be able to see summary statistics about it. | ||
| If you click on one of the frames, you'll be able to see summary statistics about it. | ||
|  | ||
| ### ⬅️Left Heavy | ||
| 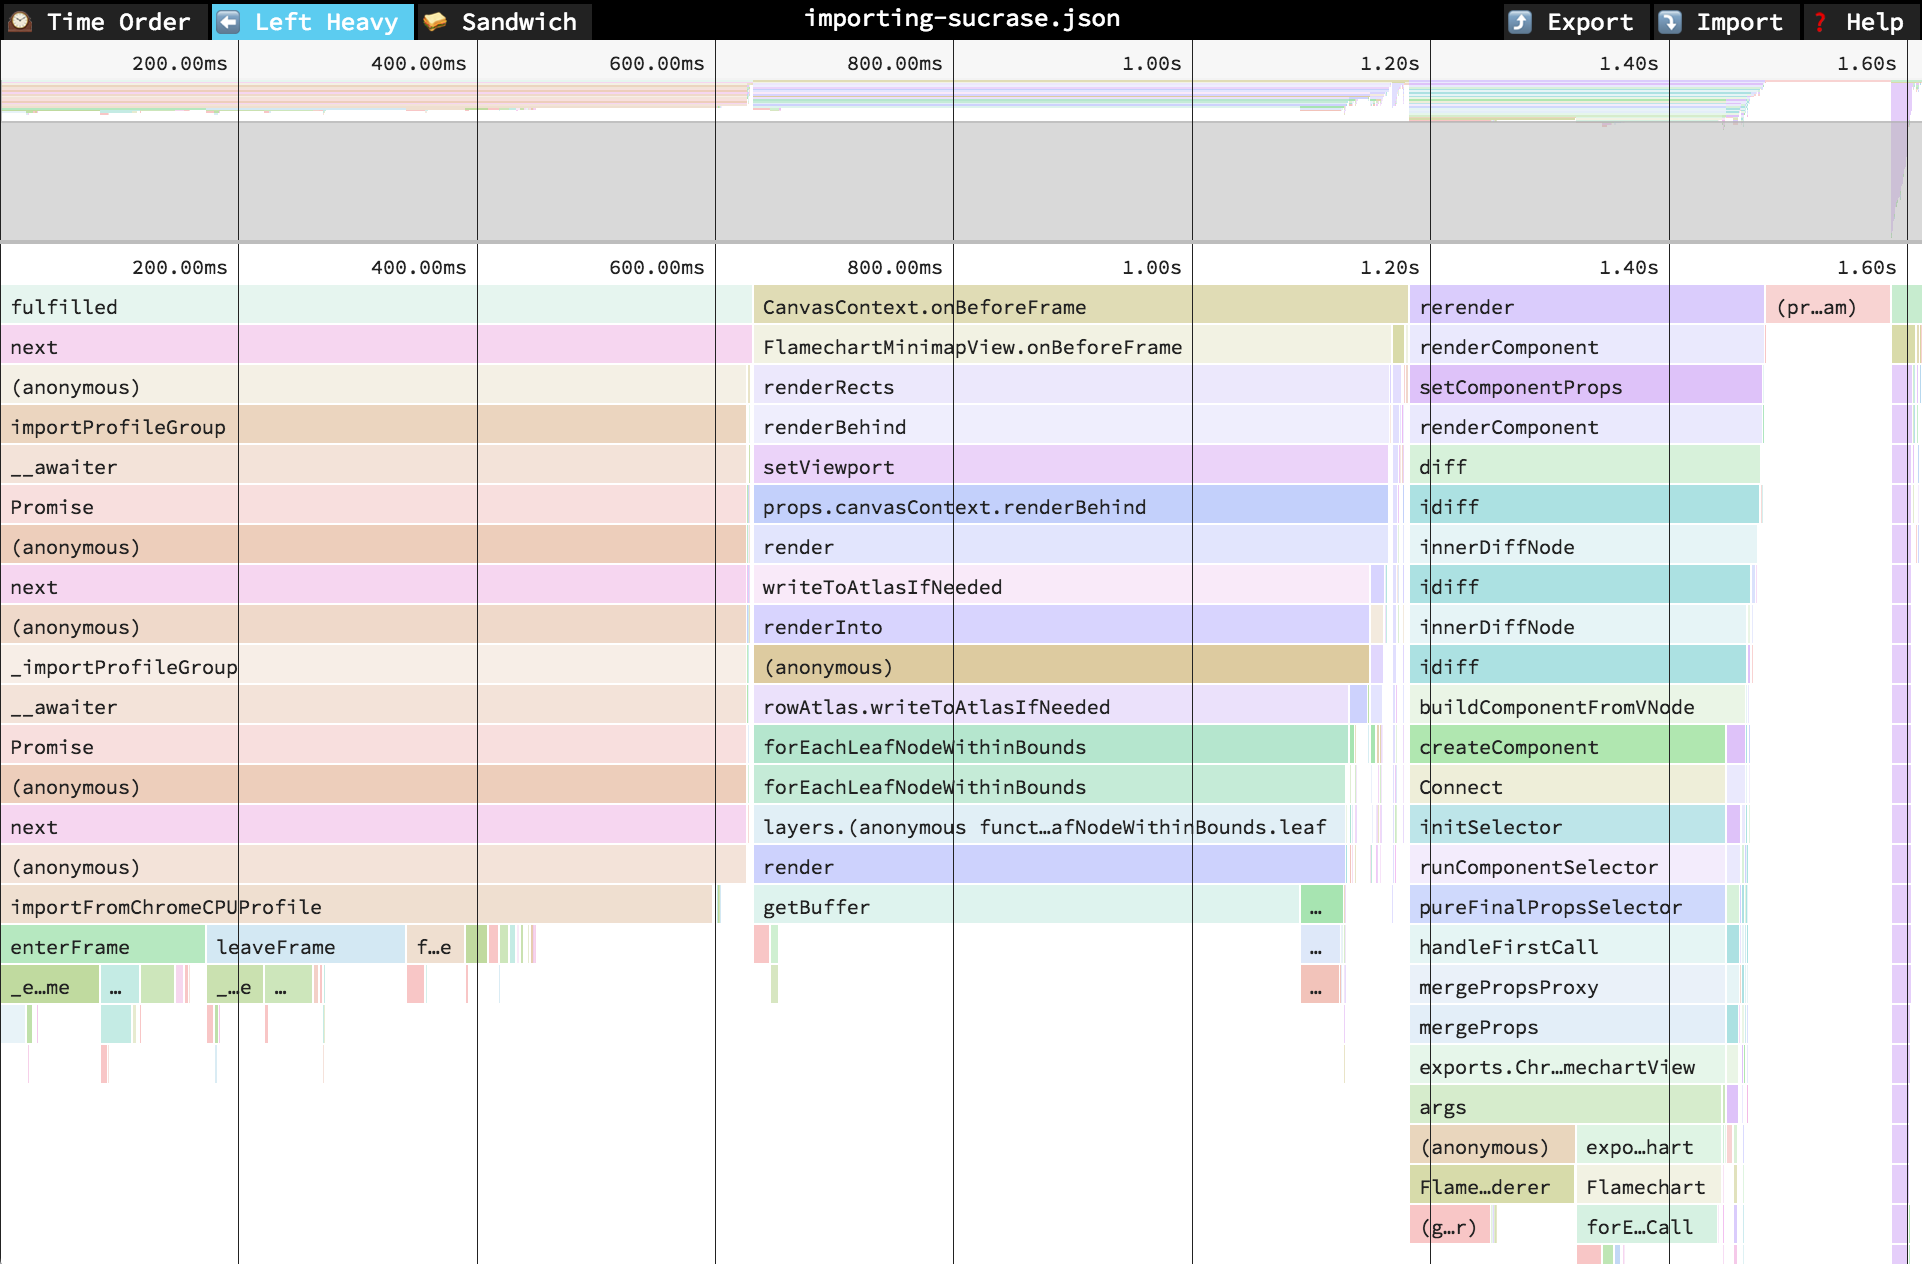 | ||
@@ -101,2 +73,3 @@ In the "Left Heavy" view, identical stacks are grouped together, regardless of whether they were recorded sequentially. Then, the stacks are sorted so that the heaviest stack for each parent is on the left -- hence "left heavy". This view is useful for understanding where all the time is going in situations where there are hundreds or thousands of function calls interleaved between other call stacks. | ||
| ### 🥪 Sandwich | ||
| 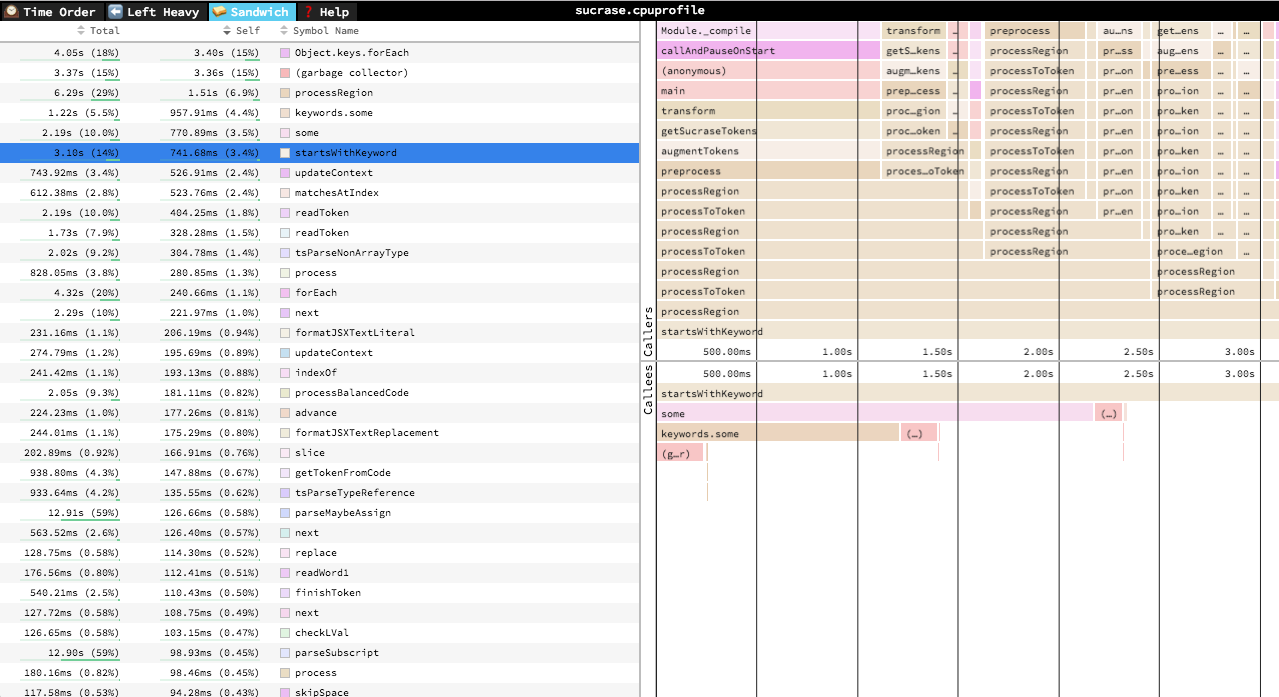 | ||
@@ -107,3 +80,2 @@ The Sandwich view is a table view in which you can find a list of all functions an their associated times. You can sort by self time or total time. | ||
|  | ||
@@ -141,1 +113,5 @@ ## Navigation | ||
| * `p`: Go to previous profile/thread if one is available | ||
| ## Contributing | ||
| Do you want to contribute to speedscope? Sweeeeet. Check out [CONTRIBUTING.md](./CONTRIBUTING.md) for instructions on setting up your dev environment. |
Sorry, the diff of this file is too big to display
Sorry, the diff of this file is too big to display
Sorry, the diff of this file is not supported yet
New alerts
License Policy Violation
LicenseThis package is not allowed per your license policy. Review the package's license to ensure compliance.
Found 1 instance in 1 package
Minified code
QualityThis package contains minified code. This may be harmless in some cases where minified code is included in packaged libraries, however packages on npm should not minify code.
Found 1 instance in 1 package
Fixed alerts
License Policy Violation
LicenseThis package is not allowed per your license policy. Review the package's license to ensure compliance.
Found 1 instance in 1 package
Minified code
QualityThis package contains minified code. This may be harmless in some cases where minified code is included in packaged libraries, however packages on npm should not minify code.
Found 1 instance in 1 package
No v1
QualityPackage is not semver >=1. This means it is not stable and does not support ^ ranges.
Found 1 instance in 1 package
Improved metrics
- Total package byte prevSize
- increased by0.08%
741176
- Lines of code
- increased by0.09%
2253
- Number of low quality alerts
- decreased by-20%
4
Worsened metrics
- Number of lines in readme file
- decreased by-17.65%
112