
vue-gantt-chart
基于 Vue 实现的 gantt-like 图表 ,用于排班展示


Feature
- 虚拟列表,快速渲染可视区域,支持大量数据渲染
- 可变时间轴,1 分钟,2 分钟,3 分钟,4 分钟~~~到一天
- 可变单元格
- 标记线
- 支持自定义描述和容器块
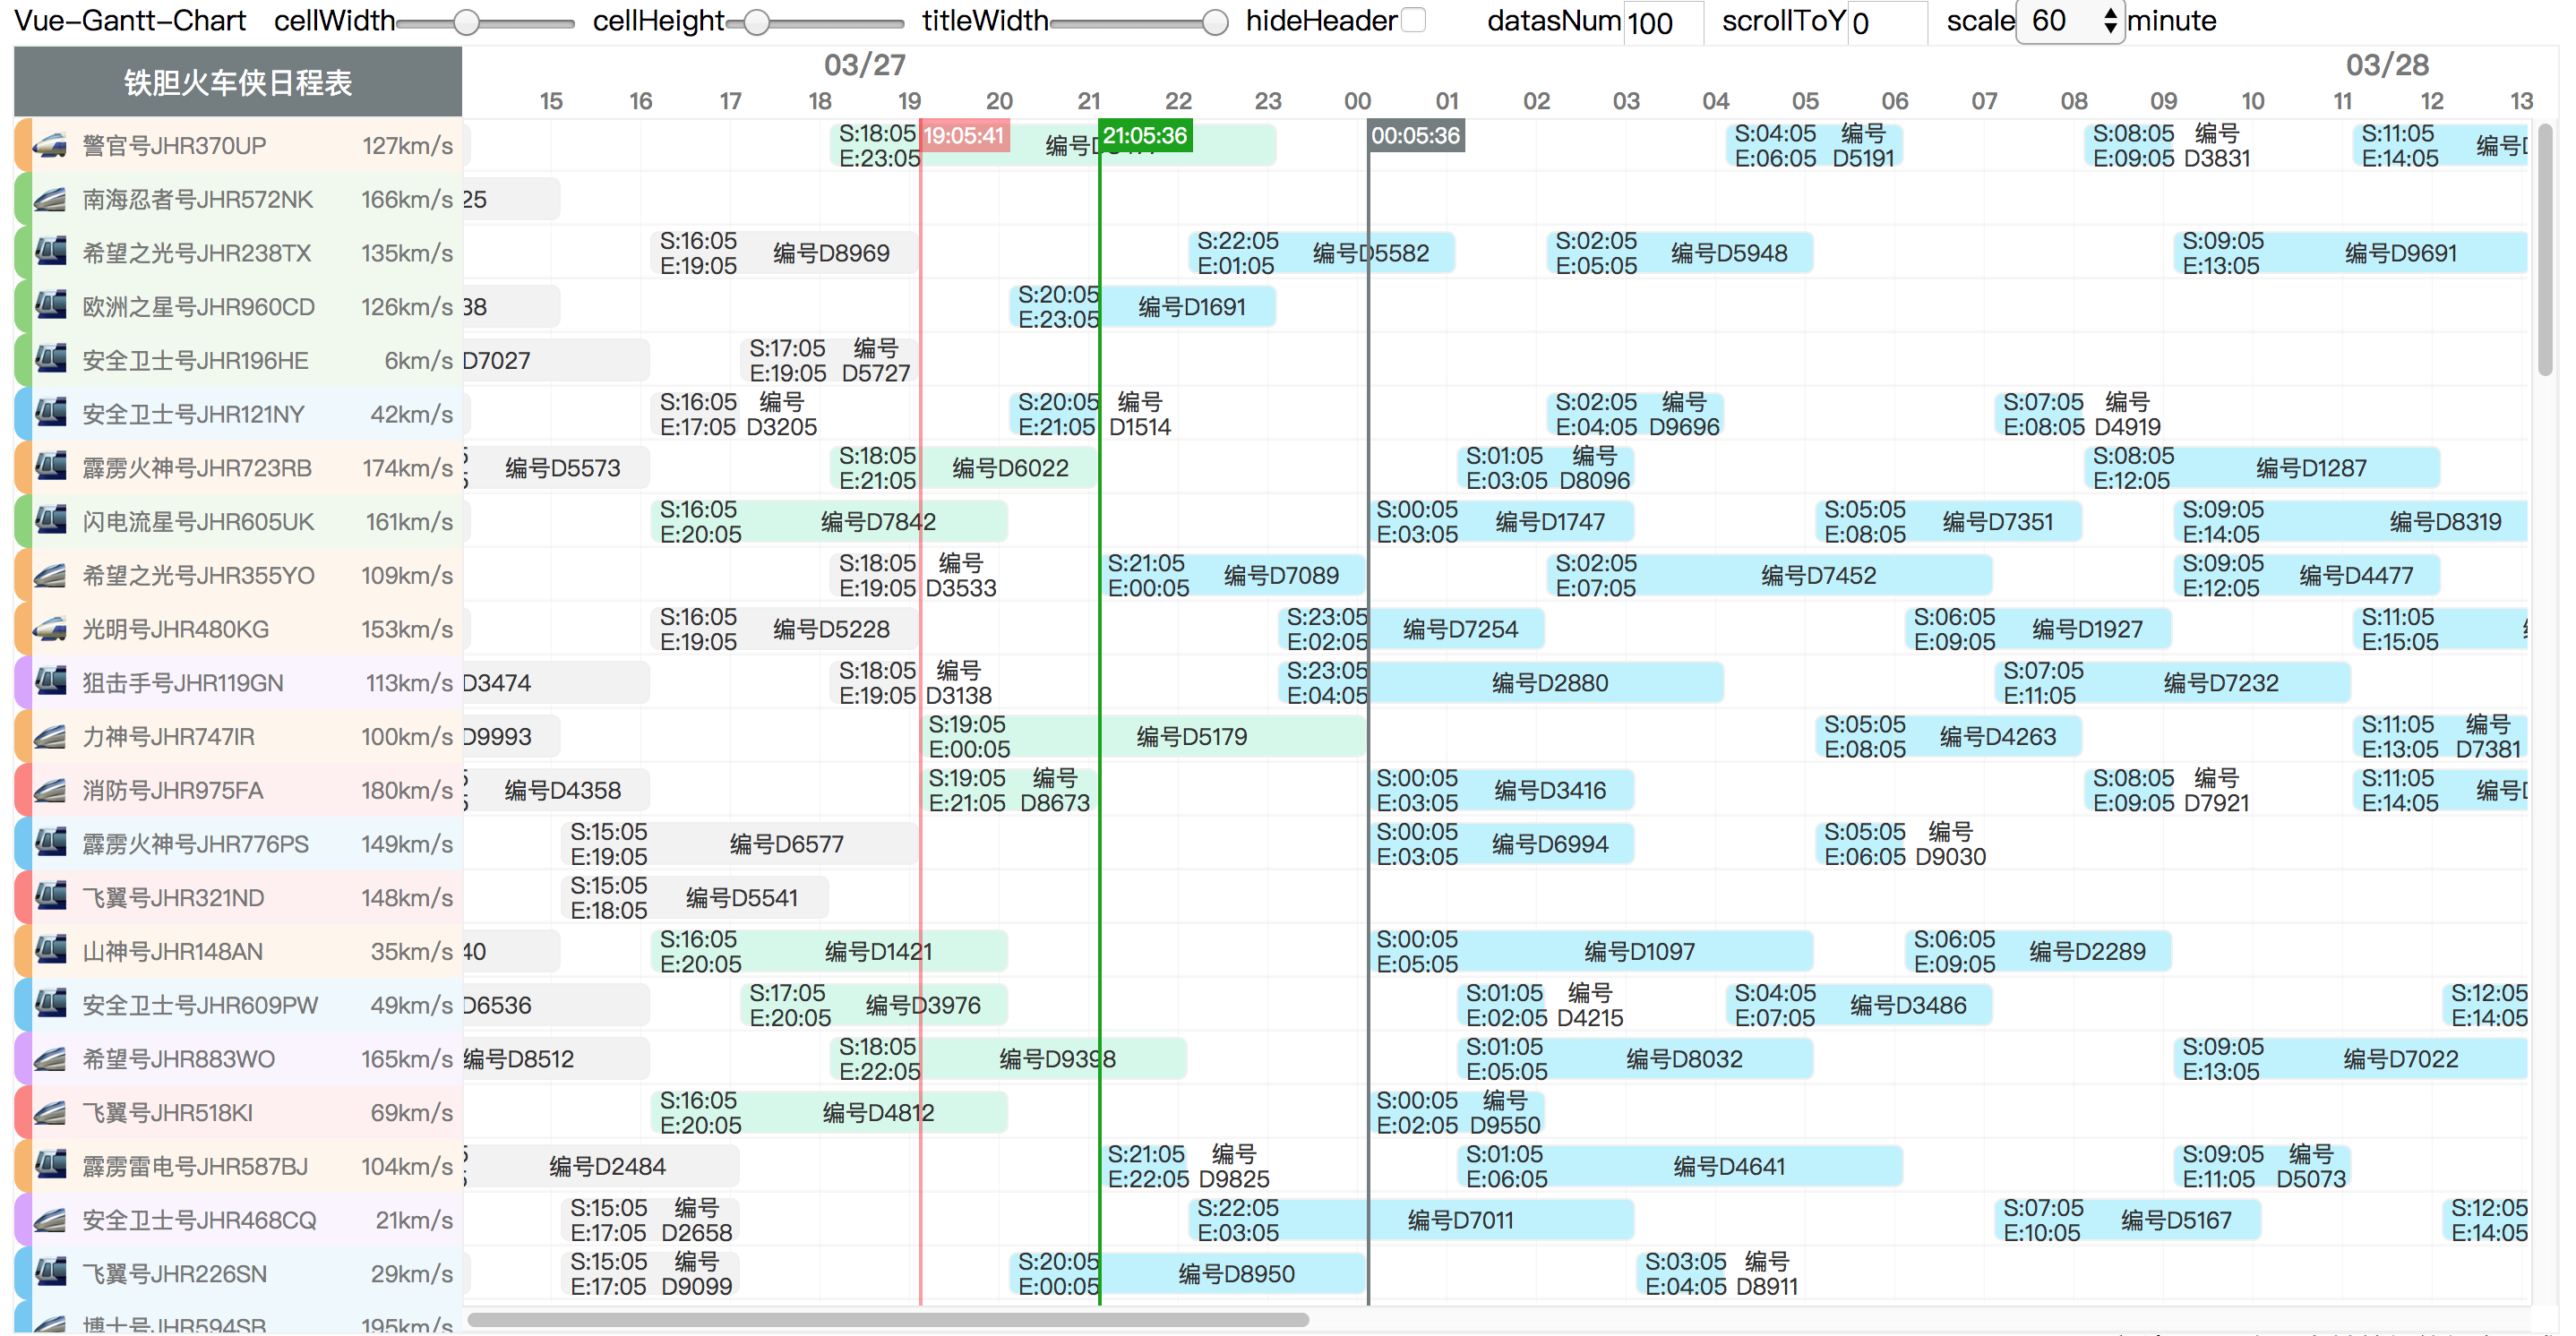
Screenshot
Install
npm i v-gantt-chart --save
Include plugin in your main.js file.
import Vue from 'vue'

import vGanttChart from 'v-gantt-chart';

Vue.use(vGanttChart});
Use
template code
<template>
<v-gantt-chart :startTime="startTime"
:endTime="endTime"
:datas="datas">
<template v-slot:block="{data,item}">
<Test :data="data" :item="item"></Test>
</template>
<template v-slot:left="{data}">
<TestLeft :data="data"></TestLeft>
</template>
<template v-slot:title>
hola
</template>
</v-gantt-chart>
</template>
script code
import Test from "./test.vue";
import TestLeft from "./test-left.vue";
import { mockDatas } from "@src/mock/index.js";
import dayjs from "dayjs"
export default {
name: "App",
components: { Test, TestLeft },
data() {
return {
startTime: dayjs().toString(),
endTime: dayjs()
.add(2, "d")
.add(2, "h")
.add(5, "s").toString(),
datas: mockDatas(100),
};
},
};
在默认情况下(即customGenerateBlocks为false)的渲染的数据需要特殊格式 ,目前要求数组中每一个值均为对象,且有gtAarry对象数组这个属性(默认取gtArray,也可以自定义多个数组key值)
//数组中每一个对象需有两个属性,start和end(不提供的情况,偏移与宽度将为0),需为合法的时间字符串.例如
[
{
id:'test',
gtArray:[
{
name:'test',
start:'2019-01-11 18:18:18',
end:'2019-01-11 18:18:18'
}
],
customKey:[
{
id:'test',
start:'2019-01-11 18:18:18',
end:'2019-01-11 18:18:18'
}
]
}
]
Slot
[
{
id:'test',
name:'sala',
gtArray:[
{
name:'test',
start:'2019-01-11 18:18:18',
end:'2019-01-11 18:18:18'
}
],
}
]
block 容器块slot
customGenerateBlocks 为false(默认值) 的情况
<template v-slot:block="{data,item}">
<Test :data="data" :item="item"></Test>
</template>
data 为
{
id:'test',
name:'sala',
gtArray:[{...}],
}
item 为
{
name:'test',
start:'2019-01-11 18:18:18',
end:'2019-01-11 18:18:18'
}
customGenerateBlocks 为true 的情况
此时arrayKeys,itemkey将不在生效,如何渲染,渲染什么,将由你自己决定,下方是一个例子
<template v-slot:block="{data,
                        getPositonOffset,
                        getWidthAbout2Times,
                        isInRenderingTimeRange}">
  <div class="myBlockContainer"
        v-for="item in data.gtArray"
        v-if="isInRenderingTimeRange(item.start)
              ||isInRenderingTimeRange(item.end)"
        :key="item.id"
        :style="{position:'absolute',
                left:getPositonOffset(item.start)+'px',
                width:getWidthAbout2Times(item.start,item.end)+'px'}">
    <Test :data="data"
          :item="item"></Test>
  </div>
</template>
data 为
{
id:'test',
name:'sala',
gtArray:[{...}],
}
getPositonOffset(time:string):number
定位函数,根据给定字符串形式的时间生成相对时间轴起点的的偏移值
getWidthAbout2Times(start:string,end:string):number
为宽度计算函数,根据给定字符串形式的时间计算两个时间差的宽度值
isInRenderingTimeRange(time:string):boolean
判定给定的时间是否在屏幕显示的时间轴范围之内
left 行名slot
<template v-slot:left="{data}">
<TestLeft :data="data"></TestLeft>
</template>
data 为
{
id:'test',
name:'sala',
gtArray:[{...}],
}
title 标题slot
<template v-slot:title>
hola
</template>
API
.param table th:first-of-type {
width: 100px;
}
.param table th:nth-of-type(2) {
width: 100px;
}
.param table th:nth-of-type(4) {
width: 100px;
}
Param
| param | required | type | default | describe |
|---|
| startTime | ❌ | string | 当前时间 | 时间轴开始时间,需为合法的时间字符串,如:2019-01-11 18:18:18 |
| endTime | ❌ | string | 当前时间 | 时间轴结束时间,需为合法的时间字符串,如:2019-01-11 18:18:18 |
| cellWidth | ❌ | number | 50 | 时间区间的宽度 |
| cellHeight | ❌ | number | 20 | 时间区间的高度 |
| titleHeight | ❌ | number | 40 | 表头的高度 |
| titleWidth | ❌ | number | 200 | 表头和行的宽度 |
| scale | ❌ | number | 60 | 时间轴的刻度值。单位:分钟,允许值[1, 2, 3, 4, 5, 6, 10, 12, 15, 20, 30, 60, 120,180,240,360, 720, 1440] |
| datas | ❌ | array | [] | 在默认情况下(即customGenerateBlocks为false)的渲染的数据需要特殊格式 ,目前要求数组中每一个值均为对象,且有gtAarry对象数组这个属性,gtArray中每一个对象需有两个属性,start和end(不提供的情况,偏移与宽度将为0),需为合法的时间字符串.例如[{id:'test',gtArray:[{start:'2019-01-11 18:18:18',end:'2019-01-11 18:18:18'}]}] 其他不做限制。 |
| arrayKeys | ❌ | array | ["gtArray"] | 需要渲染的数组的key |
| dataKey | ❌ | string | -- | 渲染的每一行的key |
| itemKey | ❌ | string | -- | 渲染的每一个gantt容器的key |
| showCurrentTime | ❌ | boolean | false | 显示当前时间,每秒钟更新 |
| timelines | ❌ | array | -- | 显示标记时间,有特殊格式 [{time:'2019-01-11 18:18:18',color:'#00000'}] |
| scrollToTime | ❌ | string | -- | 滚动到指定的时间,需为合法的时间字符串 |
| scrollToPostion | ❌ | object | -- | 滚动到指定的位置 格式为 {x:number,y:number} |
| hideHeader | ❌ | boolean | false | 隐藏时间轴和表头 |
| hideXS | ❌ | boolean | false | 隐藏时间轴和表头 |
| hideXScrollBar | ❌ | boolean | false | 隐藏横向滚动轴 |
| hideYScrollBar | ❌ | boolean | false | 隐藏纵向滚动轴 |
| customGenerateBlocks | ❌ | boolean | false | 开启自定义生成渲染块,具体使用见说明 |
.event table th:first-of-type {
width: 100px;
}
.event table th:nth-of-type(2) {
width: 100px;
}
.event table th:nth-of-type(3) {
width: 300px;
}
Event
| event | type | describle |
|---|
| scrollLeft | number | X轴的滚动值 |
| scrollTop | number | Y轴的滚动值 |
Next plan
Run Demo
注意项目需要 node 环境
npm i
npm run serve
or
yarn serve
Caution
IE 需要自己处理一些ployfill
Update
1.3.2
1.3.1
- 替换moment 为dayjs
- 为startTime,endTime,datas添加默认值
1.3.0
- 优化渲染速度
- 相比之前的自定义渲染,添加一个新的slot,支持自定义的定位和渲染,更加的灵活
1.2.6
- 修复当时间线宽度比渲染宽度小的情况下的部分白屏
- 修复数据刷新时不重新渲染的问题
- 修复滚动条长度计算问题导致的时间线部分被隐藏
- 样式微调
1.2.5
- 修复cellheight,cellwidth 变动且不滚动时,渲染数据范围不正常的问题
- 修改样式的变动处理
1.2.4
- 修复滚动时向上滚动时会空白一行没有渲染的问题
- 修复左侧行名区数据过少时,无法盖住其底下标记线的问题
1.2.3
- 添加Resize Observer api 的polyfill
1.2.2
- 通过Resize Observer api来监听div的变化,用以修复感知不到容器大小变化引起的渲染数量不正常的问题
1.2.1
- 支持通过监听scrollLeft和scrollTop获取滚动值
- 修复页面中存在2个甘特图滚动错误的问题
- 修复没有start,end值可能引起的问题,当不存在start,end时偏移与宽度均为0值
1.2.0
- 支持隐藏滚动条
- 修复一次滚动触发2次滚动事件的问题
- 修复scrollToPosition 无法设置0值是问题
1.1.3
1.1.2
- 支持隐藏表头和时间轴功能
- 支持自定义需要渲染的数组key
- 修复横线滚动越界问题
License
MIT ©wuchouchou