You're Invited:Meet the Socket Team at BlackHat and DEF CON in Las Vegas, Aug 4-6.RSVP
Socket
Book a DemoInstallSign in
Socket

vega

Package Overview
Dependencies
Maintainers
4
Versions
188
Alerts
File Explorer

Advanced tools

Socket logo

Install Socket

Detect and block malicious and high-risk dependencies

Install

vega

The Vega visualization grammar.

6.1.2
latest
Source
npmnpm
Version published
Weekly downloads
213K
9.09%
Maintainers
4
Weekly downloads
 
Created

What is vega?

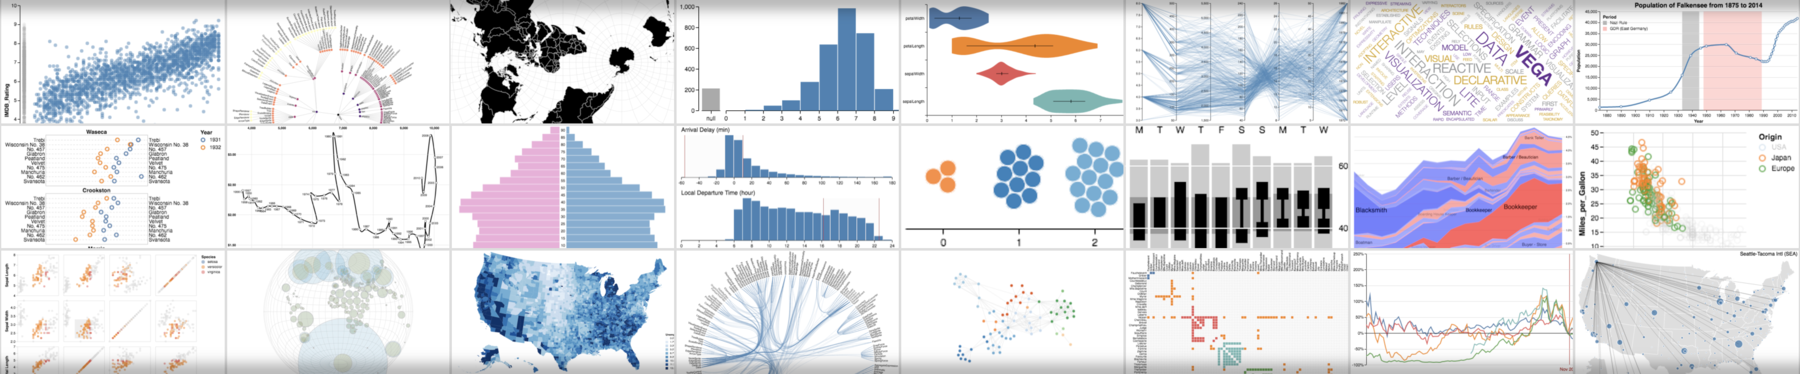
Vega is a visualization grammar, a declarative format for creating, sharing, and exploring interactive visualization designs. With Vega, you can describe data visualizations in a JSON format, and it provides a set of tools to render these visualizations in web applications.

What are vega's main functionalities?

Declarative Visualization

This code sample demonstrates how to create a simple bar chart using Vega's declarative JSON format. It defines the data, scales, axes, and marks to render the chart.

{
  "$schema": "https://vega.github.io/schema/vega/v5.json",
  "width": 400,
  "height": 200,
  "padding": 5,
  "data": [
    {
      "name": "table",
      "values": [
        {"category": "A", "amount": 28},
        {"category": "B", "amount": 55},
        {"category": "C", "amount": 43},
        {"category": "D", "amount": 91},
        {"category": "E", "amount": 81},
        {"category": "F", "amount": 53},
        {"category": "G", "amount": 19},
        {"category": "H", "amount": 87}
      ]
    }
  ],
  "scales": [
    {
      "name": "xscale",
      "type": "band",
      "domain": {"data": "table", "field": "category"},
      "range": "width",
      "padding": 0.05,
      "round": true
    },
    {
      "name": "yscale",
      "type": "linear",
      "domain": {"data": "table", "field": "amount"},
      "range": "height",
      "nice": true
    }
  ],
  "axes": [
    { "orient": "bottom", "scale": "xscale" },
    { "orient": "left", "scale": "yscale" }
  ],
  "marks": [
    {
      "type": "rect",
      "from": {"data": "table"},
      "encode": {
        "enter": {
          "x": {"scale": "xscale", "field": "category"},
          "width": {"scale": "xscale", "band": 1},
          "y": {"scale": "yscale", "field": "amount"},
          "y2": {"scale": "yscale", "value": 0}
        },
        "update": {
          "fill": {"value": "steelblue"}
        },
        "hover": {
          "fill": {"value": "red"}
        }
      }
    }
  ]
}

Interactive Visualization

This code sample demonstrates how to add interactivity to a Vega visualization. It includes a tooltip that displays the data values when hovering over the bars in the chart.

{
  "$schema": "https://vega.github.io/schema/vega/v5.json",
  "width": 400,
  "height": 200,
  "padding": 5,
  "data": [
    {
      "name": "table",
      "values": [
        {"category": "A", "amount": 28},
        {"category": "B", "amount": 55},
        {"category": "C", "amount": 43},
        {"category": "D", "amount": 91},
        {"category": "E", "amount": 81},
        {"category": "F", "amount": 53},
        {"category": "G", "amount": 19},
        {"category": "H", "amount": 87}
      ]
    }
  ],
  "signals": [
    {
      "name": "tooltip",
      "value": {},
      "on": [
        {"events": "rect:mouseover", "update": "datum"},
        {"events": "rect:mouseout", "update": "{}"}
      ]
    }
  ],
  "scales": [
    {
      "name": "xscale",
      "type": "band",
      "domain": {"data": "table", "field": "category"},
      "range": "width",
      "padding": 0.05,
      "round": true
    },
    {
      "name": "yscale",
      "type": "linear",
      "domain": {"data": "table", "field": "amount"},
      "range": "height",
      "nice": true
    }
  ],
  "axes": [
    { "orient": "bottom", "scale": "xscale" },
    { "orient": "left", "scale": "yscale" }
  ],
  "marks": [
    {
      "type": "rect",
      "from": {"data": "table"},
      "encode": {
        "enter": {
          "x": {"scale": "xscale", "field": "category"},
          "width": {"scale": "xscale", "band": 1},
          "y": {"scale": "yscale", "field": "amount"},
          "y2": {"scale": "yscale", "value": 0}
        },
        "update": {
          "fill": {"value": "steelblue"}
        },
        "hover": {
          "fill": {"value": "red"}
        }
      }
    },
    {
      "type": "text",
      "encode": {
        "enter": {
          "align": {"value": "center"},
          "baseline": {"value": "bottom"},
          "fill": {"value": "black"}
        },
        "update": {
          "x": {"scale": "xscale", "signal": "tooltip.category", "band": 0.5},
          "y": {"scale": "yscale", "signal": "tooltip.amount", "offset": -2},
          "text": {"signal": "tooltip.amount"},
          "fillOpacity": [{"test": "datum === tooltip", "value": 0}, {"value": 1}]
        }
      }
    }
  ]
}

Other packages similar to vega

Keywords

vega

FAQs

Package last updated on 29 Mar 2025

Did you know?

Socket

Socket for GitHub automatically highlights issues in each pull request and monitors the health of all your open source dependencies. Discover the contents of your packages and block harmful activity before you install or update your dependencies.

Install

Related posts