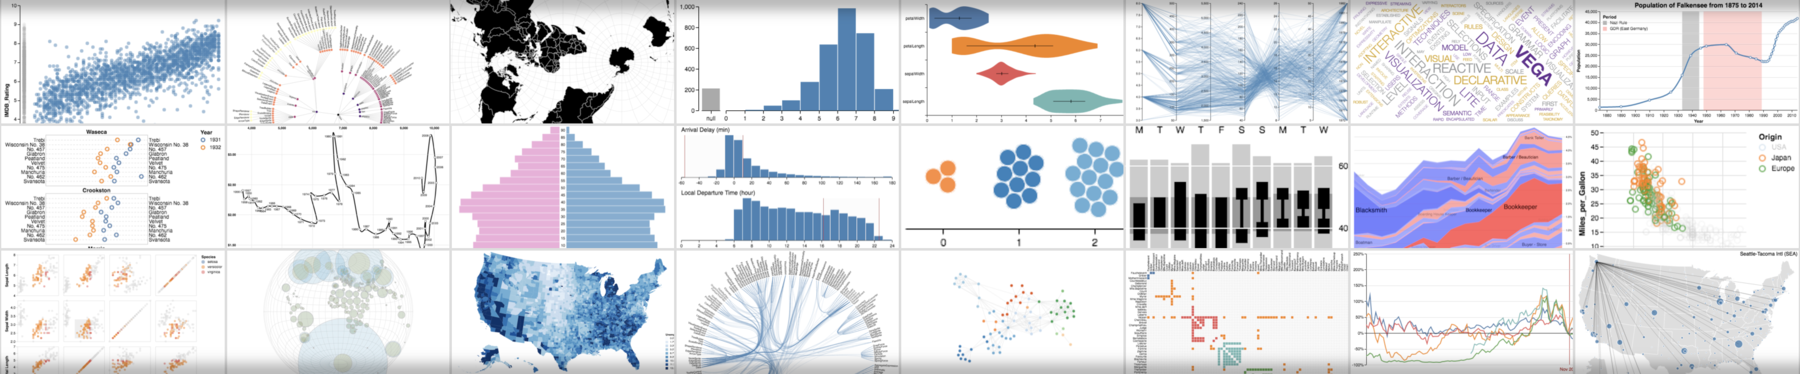
What is vega?
Vega is a visualization grammar, a declarative format for creating, sharing, and exploring interactive visualization designs. With Vega, you can describe data visualizations in a JSON format, and it provides a set of tools to render these visualizations in web applications.
What are vega's main functionalities?
Declarative Visualization
This code sample demonstrates how to create a simple bar chart using Vega's declarative JSON format. It defines the data, scales, axes, and marks to render the chart.
{
"$schema": "https://vega.github.io/schema/vega/v5.json",
"width": 400,
"height": 200,
"padding": 5,
"data": [
{
"name": "table",
"values": [
{"category": "A", "amount": 28},
{"category": "B", "amount": 55},
{"category": "C", "amount": 43},
{"category": "D", "amount": 91},
{"category": "E", "amount": 81},
{"category": "F", "amount": 53},
{"category": "G", "amount": 19},
{"category": "H", "amount": 87}
]
}
],
"scales": [
{
"name": "xscale",
"type": "band",
"domain": {"data": "table", "field": "category"},
"range": "width",
"padding": 0.05,
"round": true
},
{
"name": "yscale",
"type": "linear",
"domain": {"data": "table", "field": "amount"},
"range": "height",
"nice": true
}
],
"axes": [
{ "orient": "bottom", "scale": "xscale" },
{ "orient": "left", "scale": "yscale" }
],
"marks": [
{
"type": "rect",
"from": {"data": "table"},
"encode": {
"enter": {
"x": {"scale": "xscale", "field": "category"},
"width": {"scale": "xscale", "band": 1},
"y": {"scale": "yscale", "field": "amount"},
"y2": {"scale": "yscale", "value": 0}
},
"update": {
"fill": {"value": "steelblue"}
},
"hover": {
"fill": {"value": "red"}
}
}
}
]
}
Interactive Visualization
This code sample demonstrates how to add interactivity to a Vega visualization. It includes a tooltip that displays the data values when hovering over the bars in the chart.
{
  "$schema": "https://vega.github.io/schema/vega/v5.json",
  "width": 400,
  "height": 200,
  "padding": 5,
  "data": [
    {
      "name": "table",
      "values": [
        {"category": "A", "amount": 28},
        {"category": "B", "amount": 55},
        {"category": "C", "amount": 43},
        {"category": "D", "amount": 91},
        {"category": "E", "amount": 81},
        {"category": "F", "amount": 53},
        {"category": "G", "amount": 19},
        {"category": "H", "amount": 87}
      ]
    }
  ],
  "signals": [
    {
      "name": "tooltip",
      "value": {},
      "on": [
        {"events": "rect:mouseover", "update": "datum"},
        {"events": "rect:mouseout", "update": "{}"}
      ]
    }
  ],
  "scales": [
    {
      "name": "xscale",
      "type": "band",
      "domain": {"data": "table", "field": "category"},
      "range": "width",
      "padding": 0.05,
      "round": true
    },
    {
      "name": "yscale",
      "type": "linear",
      "domain": {"data": "table", "field": "amount"},
      "range": "height",
      "nice": true
    }
  ],
  "axes": [
    { "orient": "bottom", "scale": "xscale" },
    { "orient": "left", "scale": "yscale" }
  ],
  "marks": [
    {
      "type": "rect",
      "from": {"data": "table"},
      "encode": {
        "enter": {
          "x": {"scale": "xscale", "field": "category"},
          "width": {"scale": "xscale", "band": 1},
          "y": {"scale": "yscale", "field": "amount"},
          "y2": {"scale": "yscale", "value": 0}
        },
        "update": {
          "fill": {"value": "steelblue"}
        },
        "hover": {
          "fill": {"value": "red"}
        }
      }
    },
    {
      "type": "text",
      "encode": {
        "enter": {
          "align": {"value": "center"},
          "baseline": {"value": "bottom"},
          "fill": {"value": "black"}
        },
        "update": {
          "x": {"scale": "xscale", "signal": "tooltip.category", "band": 0.5},
          "y": {"scale": "yscale", "signal": "tooltip.amount", "offset": -2},
          "text": {"signal": "tooltip.amount"},
          "fillOpacity": [{"test": "datum === tooltip", "value": 0}, {"value": 1}]
        }
      }
    }
  ]
}
Other packages similar to vega
d3
D3.js (Data-Driven Documents) is a JavaScript library for producing dynamic, interactive data visualizations in web browsers. It uses HTML, SVG, and CSS. Unlike Vega, which uses a declarative JSON format, D3 provides a more imperative approach, giving developers fine-grained control over the visualization.
chart.js
Chart.js is a simple yet flexible JavaScript charting library for designers and developers. It offers a variety of chart types and is easy to use with a straightforward API. Compared to Vega, Chart.js is more focused on ease of use and simplicity, making it a good choice for quick and simple visualizations.
plotly.js
Plotly.js is a high-level, declarative charting library built on D3 and stack.gl. It supports a wide range of chart types and is known for its interactivity and ease of use. Plotly.js provides a higher level of abstraction compared to D3, similar to Vega, but with a focus on scientific and engineering applications.