Vue-ECharts
Vue.js component for Apache ECharts™.


Still using v6? Read v6 docs here →
Installation & Usage
npm
npm add echarts vue-echarts
Example
Vue 3 Demo →
<template>
  <v-chart class="chart" :option="option" />
</template>

<script setup>
import { use } from "echarts/core";
import { CanvasRenderer } from "echarts/renderers";
import { PieChart } from "echarts/charts";
import {
  TitleComponent,
  TooltipComponent,
  LegendComponent
} from "echarts/components";
import VChart, { THEME_KEY } from "vue-echarts";
import { ref, provide } from "vue";

use([
  CanvasRenderer,
  PieChart,
  TitleComponent,
  TooltipComponent,
  LegendComponent
]);

provide(THEME_KEY, "dark");

const option = ref({
  title: {
    text: "Traffic Sources",
    left: "center"
  },
  tooltip: {
    trigger: "item",
    formatter: "{a} <br/>{b} : {c} ({d}%)"
  },
  legend: {
    orient: "vertical",
    left: "left",
    data: ["Direct", "Email", "Ad Networks", "Video Ads", "Search Engines"]
  },
  series: [
    {
      name: "Traffic Sources",
      type: "pie",
      radius: "55%",
      center: ["50%", "60%"],
      data: [
        { value: 335, name: "Direct" },
        { value: 310, name: "Email" },
        { value: 234, name: "Ad Networks" },
        { value: 135, name: "Video Ads" },
        { value: 1548, name: "Search Engines" }
      ],
      emphasis: {
        itemStyle: {
          shadowBlur: 10,
          shadowOffsetX: 0,
          shadowColor: "rgba(0, 0, 0, 0.5)"
        }
      }
    }
  ]
});
</script>

<style scoped>
.chart {
  height: 400px;
}
</style>
Vue 2 Demo →
<template>
  <v-chart class="chart" :option="option" />
</template>

<script>
import { use } from "echarts/core";
import { CanvasRenderer } from "echarts/renderers";
import { PieChart } from "echarts/charts";
import {
  TitleComponent,
  TooltipComponent,
  LegendComponent
} from "echarts/components";
import VChart, { THEME_KEY } from "vue-echarts";

use([
  CanvasRenderer,
  PieChart,
  TitleComponent,
  TooltipComponent,
  LegendComponent
]);

export default {
  name: "HelloWorld",
  components: {
    VChart
  },
  provide: {
    [THEME_KEY]: "dark"
  },
  data() {
    return {
      option: {
        title: {
          text: "Traffic Sources",
          left: "center"
        },
        tooltip: {
          trigger: "item",
          formatter: "{a} <br/>{b} : {c} ({d}%)"
        },
        legend: {
          orient: "vertical",
          left: "left",
          data: [
            "Direct",
            "Email",
            "Ad Networks",
            "Video Ads",
            "Search Engines"
          ]
        },
        series: [
          {
            name: "Traffic Sources",
            type: "pie",
            radius: "55%",
            center: ["50%", "60%"],
            data: [
              { value: 335, name: "Direct" },
              { value: 310, name: "Email" },
              { value: 234, name: "Ad Networks" },
              { value: 135, name: "Video Ads" },
              { value: 1548, name: "Search Engines" }
            ],
            emphasis: {
              itemStyle: {
                shadowBlur: 10,
                shadowOffsetX: 0,
                shadowColor: "rgba(0, 0, 0, 0.5)"
              }
            }
          }
        ]
      }
    };
  }
};
</script>

<style scoped>
.chart {
  height: 400px;
}
</style>
[!IMPORTANT]
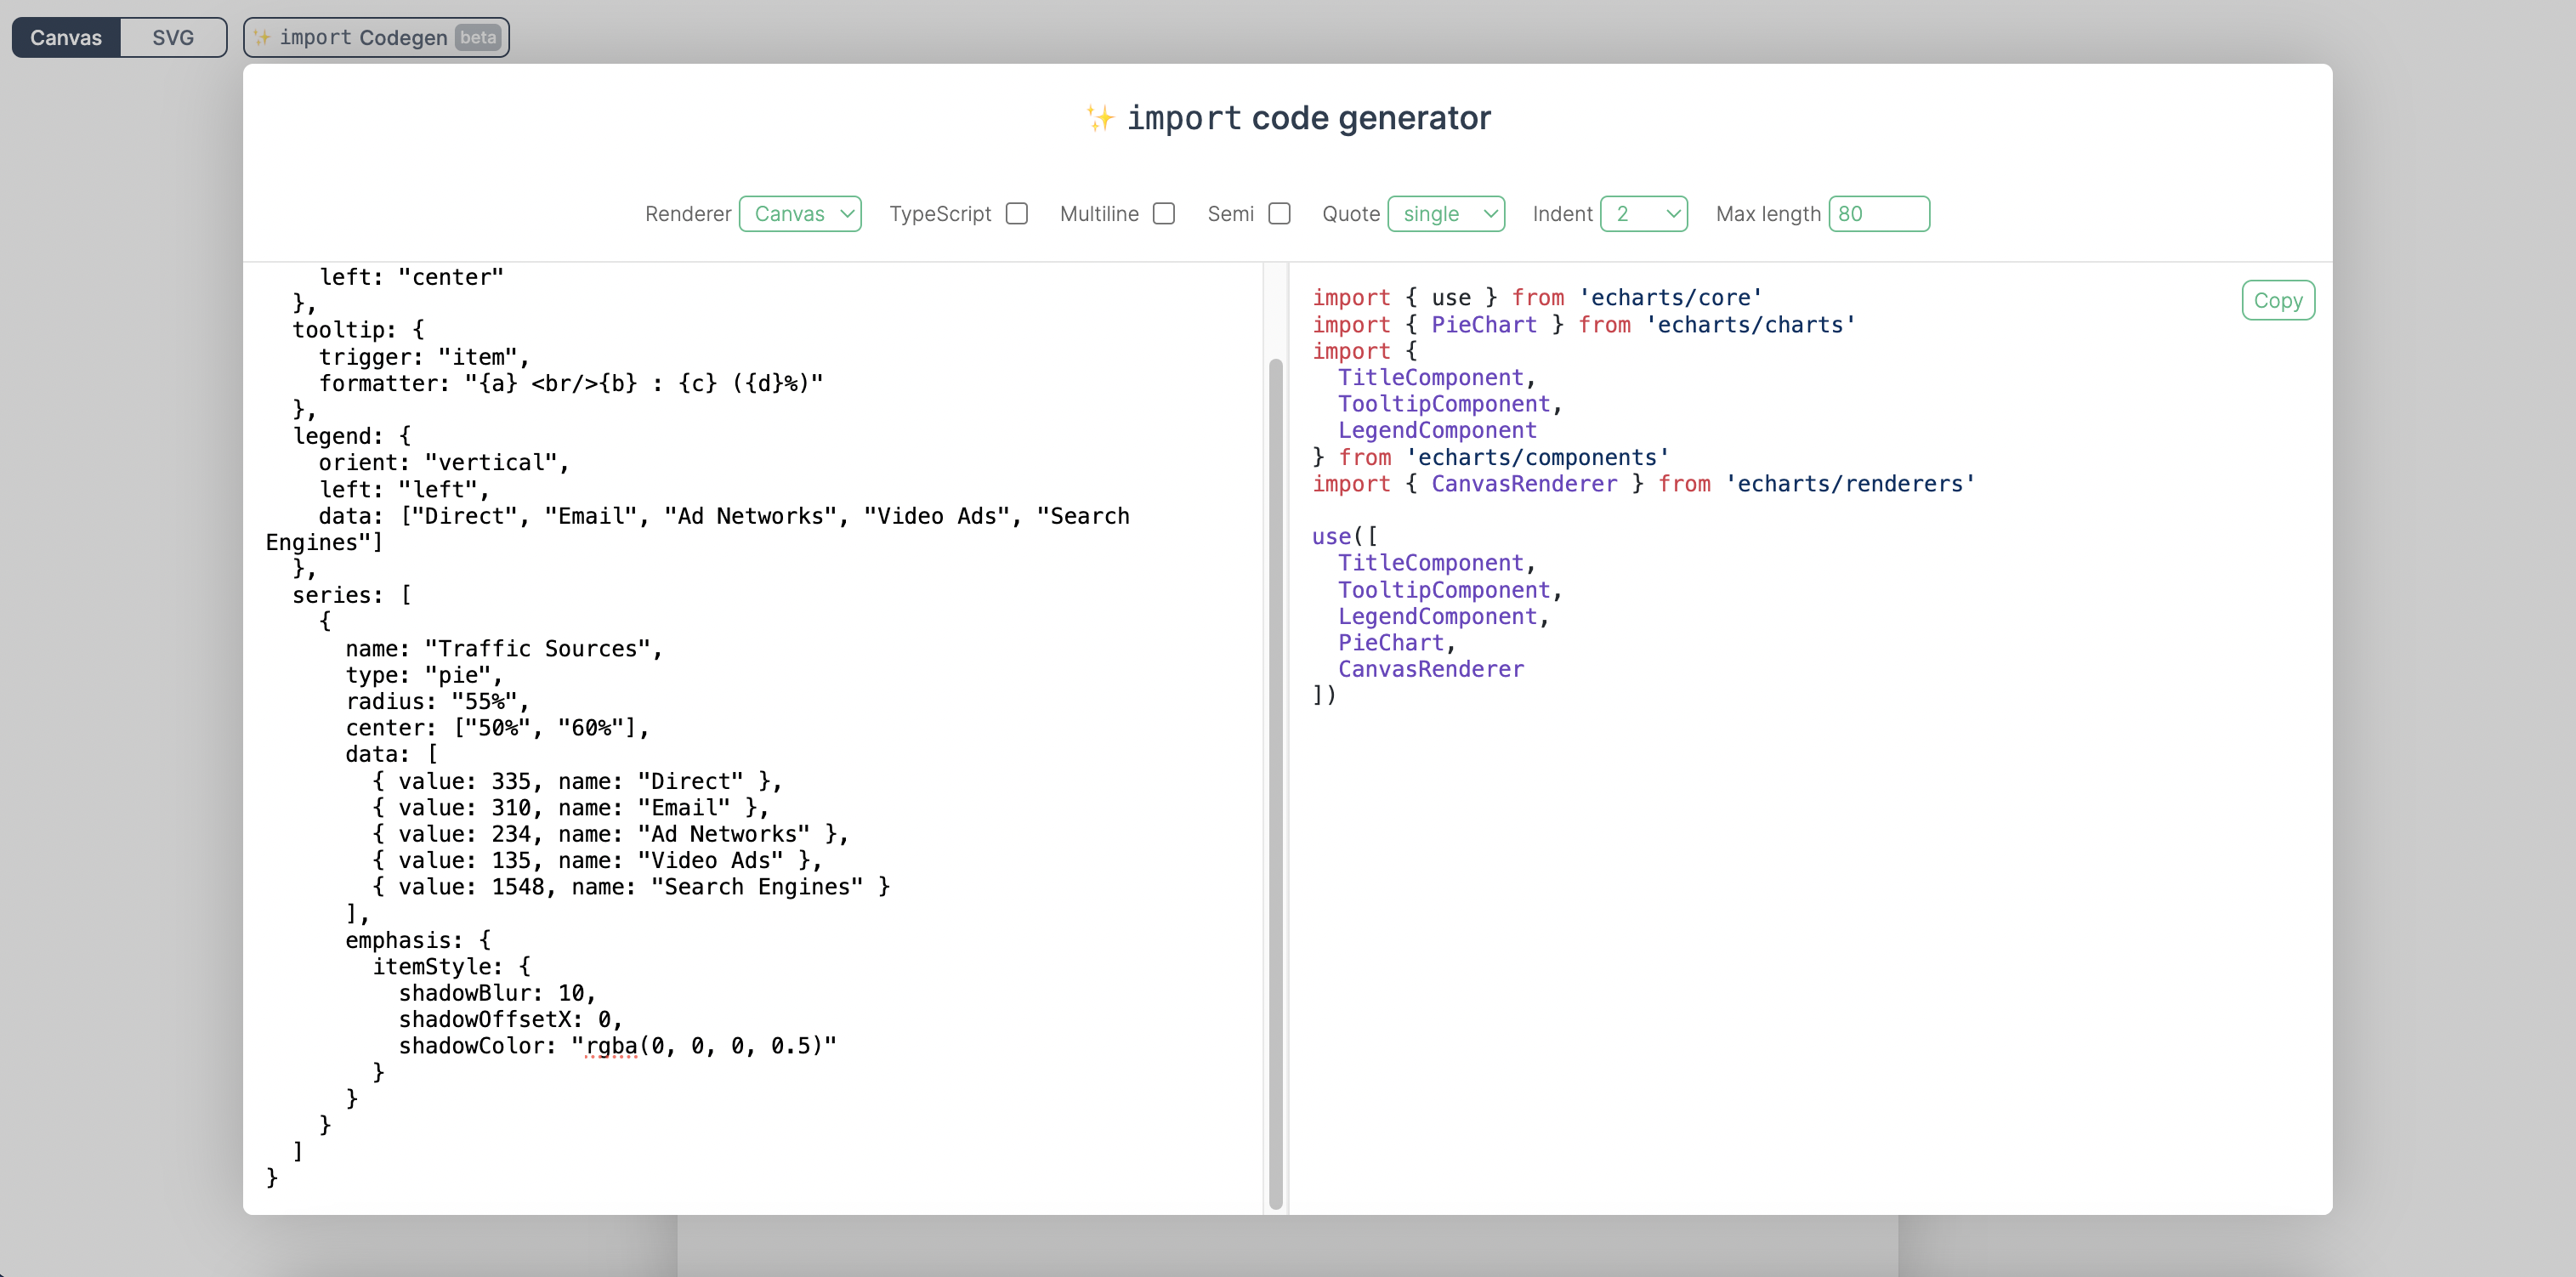
We encourage manually importing components and charts from ECharts for smaller bundle size. We've built an import code generator to help you with that. You can just paste in your option code and we'll generate the precise import code for you.

Try it →
But if you really want to import the whole ECharts bundle without having to import modules manually, just add this in your code:
import "echarts";
CDN
Drop <script> inside your HTML file and access the component via window.VueECharts.
Vue 3 Demo →
<script src="https://cdn.jsdelivr.net/npm/vue@3.4.33"></script>
<script src="https://cdn.jsdelivr.net/npm/echarts@5.5.1"></script>
<script src="https://cdn.jsdelivr.net/npm/vue-echarts@7.0.3"></script>
const app = Vue.createApp(...)
app.component('v-chart', VueECharts)
Vue 2 Demo →
<script src="https://cdn.jsdelivr.net/npm/vue@2.7.16"></script>
<script src="https://cdn.jsdelivr.net/npm/echarts@5.5.1"></script>
<script src="https://cdn.jsdelivr.net/npm/vue-echarts@7.0.3"></script>
Vue.component("v-chart", VueECharts);
See more examples here.
Props
-
init-options: object
Optional chart init configurations. See echarts.init's opts parameter here →
Injection key: INIT_OPTIONS_KEY.
-
theme: string | object
Theme to be applied. See echarts.init's theme parameter here →
Injection key: THEME_KEY.
-
option: object
ECharts' universal interface. Modifying this prop will trigger ECharts' setOption method. Read more here →
💡 When update-options is not specified, notMerge: false will be specified by default when the setOption method is called if the option object is modified directly and the reference remains unchanged; otherwise, if a new reference is bound to option, notMerge: true will be specified.
-
update-options: object
Options for updating chart option. See echartsInstance.setOption's opts parameter here →
Injection key: UPDATE_OPTIONS_KEY.
-
group: string
Group name to be used in chart connection. See echartsInstance.group here →
-
autoresize: boolean | { throttle?: number, onResize?: () => void } (default: false)
Whether the chart should be resized automatically whenever its root is resized. Use the options object to specify a custom throttle delay (in milliseconds) and/or an extra resize callback function.
-
loading: boolean (default: false)
Whether the chart is in loading state.
-
loading-options: object
Configuration item of loading animation. See echartsInstance.showLoading's opts parameter here →
Injection key: LOADING_OPTIONS_KEY.
-
manual-update: boolean (default: false)
For performance critical scenarios (having a large dataset) we'd better bypass Vue's reactivity system for option prop. By specifying manual-update prop with true and not providing option prop, the dataset won't be watched any more. After doing so, you need to retrieve the component instance with ref and manually call setOption method to update the chart.
Events
You can bind events with Vue's v-on directive.
<template>
  <v-chart :option="option" @highlight="handleHighlight" />
</template>
Note
Only the .once event modifier is supported as other modifiers are tightly coupled with the DOM event system.
Vue-ECharts support the following events:
highlight →downplay →selectchanged →legendselectchanged →legendselected →legendunselected →legendselectall →legendinverseselect →legendscroll →datazoom →datarangeselected →timelinechanged →timelineplaychanged →restore →dataviewchanged →magictypechanged →geoselectchanged →geoselected →geounselected →axisareaselected →brush →brushEnd →brushselected →globalcursortaken →rendered →finished →- Mouse events
click →dblclick →mouseover →mouseout →mousemove →mousedown →mouseup →globalout →contextmenu →
- ZRender events
zr:clickzr:mousedownzr:mouseupzr:mousewheelzr:dblclickzr:contextmenu
See supported events here →
Native DOM Events
As Vue-ECharts binds events to the ECharts instance by default, there is some caveat when using native DOM events. You need to prefix the event name with native: to bind native DOM events (or you can use the .native modifier in Vue 2, which is dropped in Vue 3).
<template>
  <v-chart @native:click="handleClick" />
</template>
Provide / Inject
Vue-ECharts provides provide/inject API for theme, init-options, update-options and loading-options to help configuring contextual options. eg. for init-options you can use the provide API like this:
Vue 3
import { THEME_KEY } from 'vue-echarts'
import { provide } from 'vue'
provide(THEME_KEY, 'dark')
{
provide: {
[THEME_KEY]: 'dark'
}
}
Vue 2
import { THEME_KEY } from 'vue-echarts'
{
provide: {
[THEME_KEY]: 'dark'
}
}
Note
You need to provide an object for Vue 2 if you want to change it dynamically.
{
data () {
return {
theme: { value: 'dark' }
}
},
provide () {
return {
[THEME_KEY]: this.theme
}
}
}
Methods
setOption →getWidth →getHeight →getDom →getOption →resize →dispatchAction →convertToPixel →convertFromPixel →containPixel →showLoading →hideLoading →getDataURL →getConnectedDataURL →clear →dispose →
Static Methods
Static methods can be accessed from echarts itself.
CSP: style-src or style-src-elem
If you are applying a CSP to prevent inline <style> injection, you need to use vue-echarts/csp instead of vue-echarts and include vue-echarts/csp/style.css manually.
Migration to v7
Read the breaking changes document in the release log and the migration shoud be straightforward.
Local development
pnpm i
pnpm serve
Open http://localhost:8080 to see the demo.
Notice
The Apache Software Foundation Apache ECharts, ECharts, Apache, the Apache feather, and the Apache ECharts project logo are either registered trademarks or trademarks of the Apache Software Foundation.


