.. image:: https://img.shields.io/pypi/v/dvg-pyqtgraph-threadsafe
:target: https://pypi.org/project/dvg-pyqtgraph-threadsafe
.. image:: https://img.shields.io/pypi/pyversions/dvg-pyqtgraph-threadsafe
:target: https://pypi.org/project/dvg-pyqtgraph-threadsafe
.. image:: https://img.shields.io/badge/code%20style-black-000000.svg
:target: https://github.com/psf/black
.. image:: https://img.shields.io/badge/License-MIT-purple.svg
:target: https://github.com/Dennis-van-Gils/python-dvg-pyqtgraph-threadsafe/blob/master/LICENSE.txt
DvG_PyQtGraph_ThreadSafe
PyQtGraph library providing thread-safe plot curves with underlying (ring)
buffers.
Supports PyQt5, PyQt6, PySide2 and PySide6.
Installation::
pip install dvg-pyqtgraph-threadsafe
You must also ensure a Qt library is installed in your Python environment as
this library will not install one for you. Pick one (personal recommendation
PySide6)::
pip install pyqt5
pip install pyqt6
pip install pyside2
pip install pyside6
Futhermore, you might want to enable OpenGL hardware accelerated plotting by
installing PyOpenGL::
pip install pyopengl
Useful links
- Demos can be found in the
demos folder <https://github.com/Dennis-van-Gils/python-dvg-pyqtgraph-threadsafe/tree/master/demos>__.
- Benchmark tests and results can be found in the
benchmark folder <https://github.com/Dennis-van-Gils/python-dvg-pyqtgraph-threadsafe/tree/master/benchmark>__.
- Important notes on the specific use-case where another thread is actively requesting data at a high rate from an external device (e.g. an Arduino) to be pushed into a ThreadSafeCurve can be found
here <https://github.com/Dennis-van-Gils/DvG_Arduino_PyQt_multithread_demo/blob/master/README.rst#pyqtgraph--opengl-performance>__.
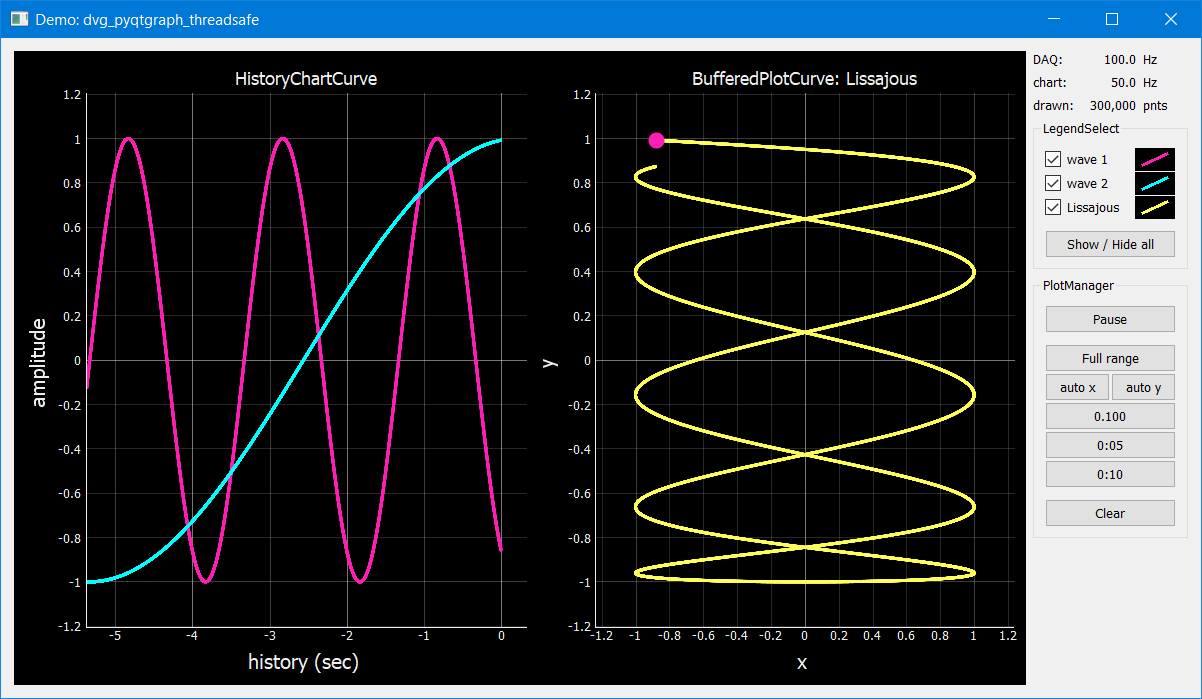
.. image:: https://raw.githubusercontent.com/Dennis-van-Gils/python-dvg-pyqtgraph-threadsafe/master/demos/demo_pyqtgraph_threadsafe.png
Overview
Classes HistoryChartCurve, BufferedPlotCurve & PlotCurve wrap around
a pyqtgraph.PlotDataItem instance, called a curve for convenience. Data
can be safely appended or set from out of any thread.
The (x, y)-curve data is buffered internally to the class, relying on either a
circular/ring buffer or a regular array buffer:
-
HistoryChartCurve
Ring buffer. The plotted x-data will be shifted such that the
right-side is always set to 0. I.e., when x denotes time, the data is
plotted backwards in time, hence the name history chart. The most
recent data is on the right-side of the ring buffer.
-
BufferedPlotCurve
Ring buffer. Data will be plotted as is. Can also act as a Lissajous
figure.
-
PlotCurve
Regular array buffer. Data will be plotted as is.
Usage
.. code-block:: python

    import sys

    from qtpy import QtWidgets
    import pyqtgraph as pg

    from dvg_pyqtgraph_threadsafe import HistoryChartCurve

    class MainWindow(QtWidgets.QWidget):
        def __init__(self, parent=None, **kwargs):
            super().__init__(parent, **kwargs)

            self.gw = pg.GraphicsLayoutWidget()
            self.plot_1 = self.gw.addPlot()

            # Create a HistoryChartCurve and have it wrap around a new
            # PlotDataItem as set by argument `linked_curve`.
            self.tscurve_1 = HistoryChartCurve(
                capacity=5,
                linked_curve=self.plot_1.plot(pen=pg.mkPen('r')),
            )

            grid = QtWidgets.QGridLayout(self)
            grid.addWidget(self.gw)

    app = QtWidgets.QApplication(sys.argv)
    window = MainWindow()

    # The following line could have been executed from inside of another thread:
    window.tscurve_1.extendData([1, 2, 3, 4, 5], [10, 20, 30, 20, 10])

    # Draw the curve from out of the main thread
    window.tscurve_1.update()

    window.show()
    sys.exit(app.exec())
Benchmark
If you intend to use this library to plot 100.000s of points at a high frame
rate on your integrated GPU instead of on a dedicated (performance) GPU,
you might run into performance issues. Even when OpenGL hardware
acceleration is enabled.
I recommend you run the performance benchmark found in the
benchmark folder <https://github.com/Dennis-van-Gils/python-dvg-pyqtgraph-threadsafe/tree/master/benchmark>.
It can test for different PyQtGraph versions and Qt libraries on your
GPU of choice. I have found that the older pyqtgraph 0.11 library sometimes
results in a better performance than pyqtgraph 0.12 on integrated GPUs.
See benchmark results <https://github.com/Dennis-van-Gils/python-dvg-pyqtgraph-threadsafe/blob/master/benchmark/benchmark_results.rst>.
API
Class ThreadSafeCurve
.. code-block:: python
ThreadSafeCurve(
    capacity: int | None,
    linked_curve: pyqtgraph.PlotDataItem,
    shift_right_x_to_zero: bool = False,
    use_ringbuffer=None,
)
.. Note::
Provides the base class for a thread-safe plot *curve* to which
(x, y)-data can be safely appended or set from out of any thread. It
will wrap around the passed argument ``linked_curve`` of type
``pyqtgraph.PlotDataItem`` and will manage the (x, y)-data buffers
underlying the curve.

Intended multi-threaded operation: One or more threads push new data
into the ``ThreadSafeCurve``-buffers. Another thread performs the GUI
refresh by calling ``update()`` which will redraw the curve according
to the current buffer contents.

Args:
    capacity (``int``, optional):
        When an integer is supplied it defines the maximum number op points
        each of the x-data and y-data buffers can store. The x-data buffer
        and the y-data buffer are each a ring buffer. New readings are
        placed at the end (right-side) of the buffer, pushing out the oldest
        readings when the buffer has reached its maximum capacity (FIFO).
        Use methods ``appendData()`` and ``extendData()`` to push in new
        data.

        When ``None`` is supplied the x-data and y-data buffers are each a
        regular array buffer of undefined length. Use method ``setData()``
        to set the data.

    linked_curve (``pyqtgraph.PlotDataItem``):
        Instance of ``pyqtgraph.PlotDataItem`` to plot the buffered
        data out into.

    shift_right_x_to_zero (``bool``, optional):
        When plotting, should the x-data be shifted such that the
        right-side is always set to 0? Useful for history charts.

        Default: False

    use_ringbuffer (``bool``, deprecated):
        Deprecated since v3.1.0. Defined for backwards compatibility.
        Simply supply a value for ``capacity`` to enable use of a ring
        buffer.

Attributes:
    x_axis_divisor (``float``):
        The x-data in the buffer will be divided by this factor when the
        plot curve is drawn. Useful to, e.g., transform the x-axis units
        from milliseconds to seconds or minutes.

        Default: 1

    y_axis_divisor (``float``):
        Same functionality as ``x_axis_divisor``.

        Default: 1

Methods:
    * ``appendData(x, y)``
        Append a single (x, y)-data point to the ring buffer.

    * ``extendData(x_list, y_list)``
        Extend the ring buffer with a list of (x, y)-data points.

    * ``setData(x_list, y_list)``
        Set the (x, y)-data of the regular array buffer.

    * ``update(create_snapshot: bool = True)``
        Update the data behind the curve by creating a snapshot of the
        current contents of the buffer, and redraw the curve on screen.

        You can suppress updating the data behind the curve by setting parameter
        ``create_snapshot`` to False. The curve will then only be redrawn
        based on the old data. This is useful when the plot is paused.

    * ``clear()``
        Clear the contents of the curve and redraw.

    * ``name()``
        Get the name of the curve.

    * ``isVisible() -> bool``
        Is the curve visible?

    * ``setVisible(state: bool = True)``
        Set the visibility of the curve.

    * ``setDownsampling(*args, **kwargs)``
        All arguments will be passed onto method
        ``pyqtgraph.PlotDataItem.setDownsampling()`` of the underlying curve.


Properties:
    * ``size -> Tuple[int, int]``:
        Number of elements currently contained in the underlying (x, y)-
        buffers of the curve. Note that this is not necessarily the number of
        elements of the currently drawn curve. Instead, it reflects the current
        sizes of the data buffers behind it that will be drawn onto screen by
        the next call to ``update()``.
Class HistoryChartCurve
.. code-block:: python
HistoryChartCurve(
    capacity: int,
    linked_curve: pyqtgraph.PlotDataItem,
)
.. Note::
Inherits from: ``ThreadSafeCurve``

Provides a thread-safe curve with underlying ring buffers for the
(x, y)-data. New readings are placed at the end (right-side) of the
buffer, pushing out the oldest readings when the buffer has reached its
maximum capacity (FIFO). Use methods ``appendData()`` and
``extendData()`` to push in new data.

The plotted x-data will be shifted such that the right-side is always
set to 0. I.e., when ``x`` denotes time, the data is plotted backwards
in time, hence the name *history* chart.

See class ``ThreadSafeCurve`` for more details.
Class BufferedPlotCurve
.. code-block:: python
BufferedPlotCurve(
    capacity: int,
    linked_curve: pyqtgraph.PlotDataItem,
)
.. Note::
Inherits from: ``ThreadSafeCurve``

Provides a thread-safe curve with underlying ring buffers for the
(x, y)-data. New readings are placed at the end (right-side) of the
buffer, pushing out the oldest readings when the buffer has reached its
maximum capacity (FIFO). Use methods ``appendData()`` and
``extendData()`` to push in new data.

See class ``ThreadSafeCurve`` for more details.
Class PlotCurve
.. code-block:: python
PlotCurve(
    capacity: int,
    linked_curve: pyqtgraph.PlotDataItem,
)
.. Note::
Inherits from: ``ThreadSafeCurve``

Provides a thread-safe curve with underlying regular array buffers
for the (x, y)-data. Use method ``setData()`` to set the data.

See class ``ThreadSafeCurve`` for more details.
Class LegendSelect
.. code-block:: python
LegendSelect(
    linked_curves: Sequence[pyqtgraph.PlotDataItem | ThreadSafeCurve],
    hide_toggle_button: bool = False,
    box_bg_color: QtGui.QColor = QtGui.QColor(0, 0, 0),
    box_width: int = 40,
    box_height: int = 23,
    parent=None,
)
.. Note:: Inherits from: PyQt5.QtCore.QObject
Creates and manages a legend of all passed curves with checkboxes to
show or hide each curve. The legend ends with a push button to show or
hide all curves in one go. The full set of GUI elements is contained in
attribute ``grid`` of type ``PyQt5.QtWidget.QGridLayout`` to be added to
your GUI.

Example grid::

    □ Curve 1  [  /  ]
    □ Curve 2  [  /  ]
    □ Curve 3  [  /  ]
    [ Show / Hide all]

The initial visibility, name and pen of each curve will be retrieved
from the members within the passed curves, i.e.:

    * ``curve.isVisible()``
    * ``curve.name()``
    * ``curve.opts["pen"]``

Args:
    linked_curves (``Sequence[pyqtgraph.PlotDataItem | ThreadSafeCurve]``):
        Sequence of ``pyqtgraph.PlotDataItem`` or ``ThreadSafeCurve``
        instances to be controlled by the legend.

    hide_toggle_button (``bool``, optional):
        Default: False

    box_bg_color (``QtGui.QColor``, optional):
        Background color of the legend boxes.

        Default: ``QtGui.QColor(0, 0, 0)``

    box_width (``int``, optional):
        Default: 40

    box_height (``int``, optional):
        Default: 23

Attributes:
    chkbs (``List[PyQt5.QtWidgets.QCheckbox]``):
        List of checkboxes to control the visiblity of each curve.

    painted_boxes (``List[PyQt5.QtWidgets.QWidget]``):
        List of painted boxes illustrating the pen of each curve.

    qpbt_toggle (``PyQt5.QtWidgets.QPushButton``):
        Push button instance that toggles showing/hiding all curves in
        one go.

    grid (``PyQt5.QtWidgets.QGridLayout``):
        The full set of GUI elements combined into a grid to be added
        to your GUI.
Class PlotManager
.. code-block:: python
PlotManager(
    parent=None,
)
.. Note:: Inherits from: PyQt5.QtCore.QObject
Creates and manages a collection of pushbuttons with predefined actions
operating on the linked plots and curves. The full set of pushbuttons is
contained in attribute ``grid`` of type ``PyQt5.QtWidget.QGridLayout`` to be
added to your GUI.

Example grid::

    [   Full range  ]
    [auto x] [auto y]
    [      0:30     ]
    [      1:00     ]
    [      3:00     ]
    [     10:00     ]

    [     Clear     ]

The grid starts empty and is build up by calling the following methods:
    - ``add_autorange_buttons()``: Adds the [Full range], [auto x] and
      [auto y] buttons.

    - ``add_preset_buttons()``: Adds presets on the x-axis range to zoom to.

    - ``add_clear_button()``: Adds the 'Clear' button.

Args:
    parent (``PyQt5.QtWidgets.QWidget``):
        Needs to be set to the parent ``QWidget`` for the ``QMessageBox`` as
        fired by button ``Clear`` to appear centered and modal to.

Attributes:
    grid (``PyQt5.QtWidgets.QGridLayout``):
        The full set of pushbuttons combined into a grid to be added
        to your GUI.
Changelog
3.4.0 (2024-06-24)
Code quality improvements:
- Using
qtpy library instead of my own Qt5/6 mechanism
- Using f-strings
- Extended API and docstrings, like on
PlotManager.
- Arguments
linked_curves and linked_plots are hinted as Sequence instead
of as List
Added support:
3.3.0 (2023-02-27)
- Raise
ImportError instead of general Exception
3.2.6 (2022-10-13)
- Added link to notes on use-case: DAQ
3.2.5 (2022-10-13)
- Minor edit: Using explicit arguments
x and y to set the curve data and set
the flag skipFiniteCheck=True. Both save (marginal) CPU time.
3.2.4 (2022-10-12)
- Bug fix: Snapshot creation checks if internal buffer is of type RingBuffer and
casts to numpy.ndarray. This resolves an intermittent error where the
isfinite boolean return array was operating as mask on the RingBuffer, which
fails. The boolean return array now always operates on numpy.ndarray.
- Fix for external bug in
paintGL of pyqtgraph\graphicsItems\PlotCurveItem.py:
Added explicit check to ensure that the curve is only drawn when it has more
than 1 point.
- Added benchmark running
python=3.10 and pyqtgraph==0.13.1
3.2.3 (2022-10-11)
- Fixed bug when using PyQt6:
QMessageBox.Yes --> QMessageBox.StandardButton.Yes
3.2.2 (2022-09-18)
- Updated discussion on benchmarks
- The batch file for auto-creation of the conda environments found in the
benchmark folder now uses the conda-forge channel.
3.2.1 (2022-09-17)
- Neater mechanism to support both PyQt and PySide
- Added benchmarks
- Improved demos
3.2.0 (2022-09-13)
- Added support for PyQt5, PyQt6, PySide2 and PySide6 as suggested via a pull
request by Mathijs van Gorcum (https://github.com/mvgorcum).
3.1.0 (2021-05-10)
- Removed redundant argument
capacity from init PlotCurve(). It is
not using a ringbuffer and, hence, does not need a capacity.
3.0.1 (2020-08-07)
Bug-fixes:
- The use of
typing.TypedDict broke support under Python 3.6
and 3.7. Fixed by conditional import typing_extensions.
- Curve plotting was broken when
setClipToView(True) and the curve
data extended past the viewbox limits, when not using OpenGL. The cause was
my incorrect calculation of connect. Fixed by commenting out connect
again. Curves will now show continuously (linear interpolation) whenever a NaN
is encountered, instead of as correctly fragmented. That's acceptable.
3.0.0 (2020-08-07)
- Renamed parameter
LegendSelect.curves to
LegendSelect.linked_curves
- Changed base of class
LegendSelect() from QWidget to QObject
- Added class
PlotManager()
2.0.1 (2020-08-03)
- Workaround:
PyQt5 >= 5.12.3 causes a bug in PyQtGraph where a
curve won't render if it contains NaNs (but only in the case when OpenGL is
disabled). The curve will now be displayed correctly, i.e., fragmented
whenever a NaN is encountered. When OpenGL is enabled, linear interpolation
will occur at the gaps as per pyqtgraph.plotCurveItem.paintGL().
2.0.0 (2020-08-02)
- Method names are now conform the
PyQtGraph naming style. I.e.
setData() vs. set_data(), etc.
- The default values of
PyQtGraph are no longer being overwritten.
- Added class
LegendSelect
1.0.0 (2020-07-30)


