| Call for Contributors to the FinanceDatabase |
|---|
| The FinanceDatabase serves the role of providing anyone with any type of financial product categorization entirely for free. To be able to achieve this, the FinanceDatabase relies on involvement from the community to add, edit and remove tickers over time. This is made easy enough that anyone, even with a lack of coding experience can contribute because of the usage of CSV files that can be manually edited with ease. |
| I'd like to invite you to go to the Contributing Guidelines to understand how you can help. Thank you! |
As a private investor, the sheer amount of information that can be found on the internet is rather daunting. Trying to understand what type of companies or ETFs are available is incredibly challenging with there being millions of companies and derivatives available on the market. Sure, the most traded companies and ETFs can quickly be found simply because they are known to the public (for example, Microsoft, Tesla, S&P500 ETF or an All-World ETF). However, what else is out there is often unknown.
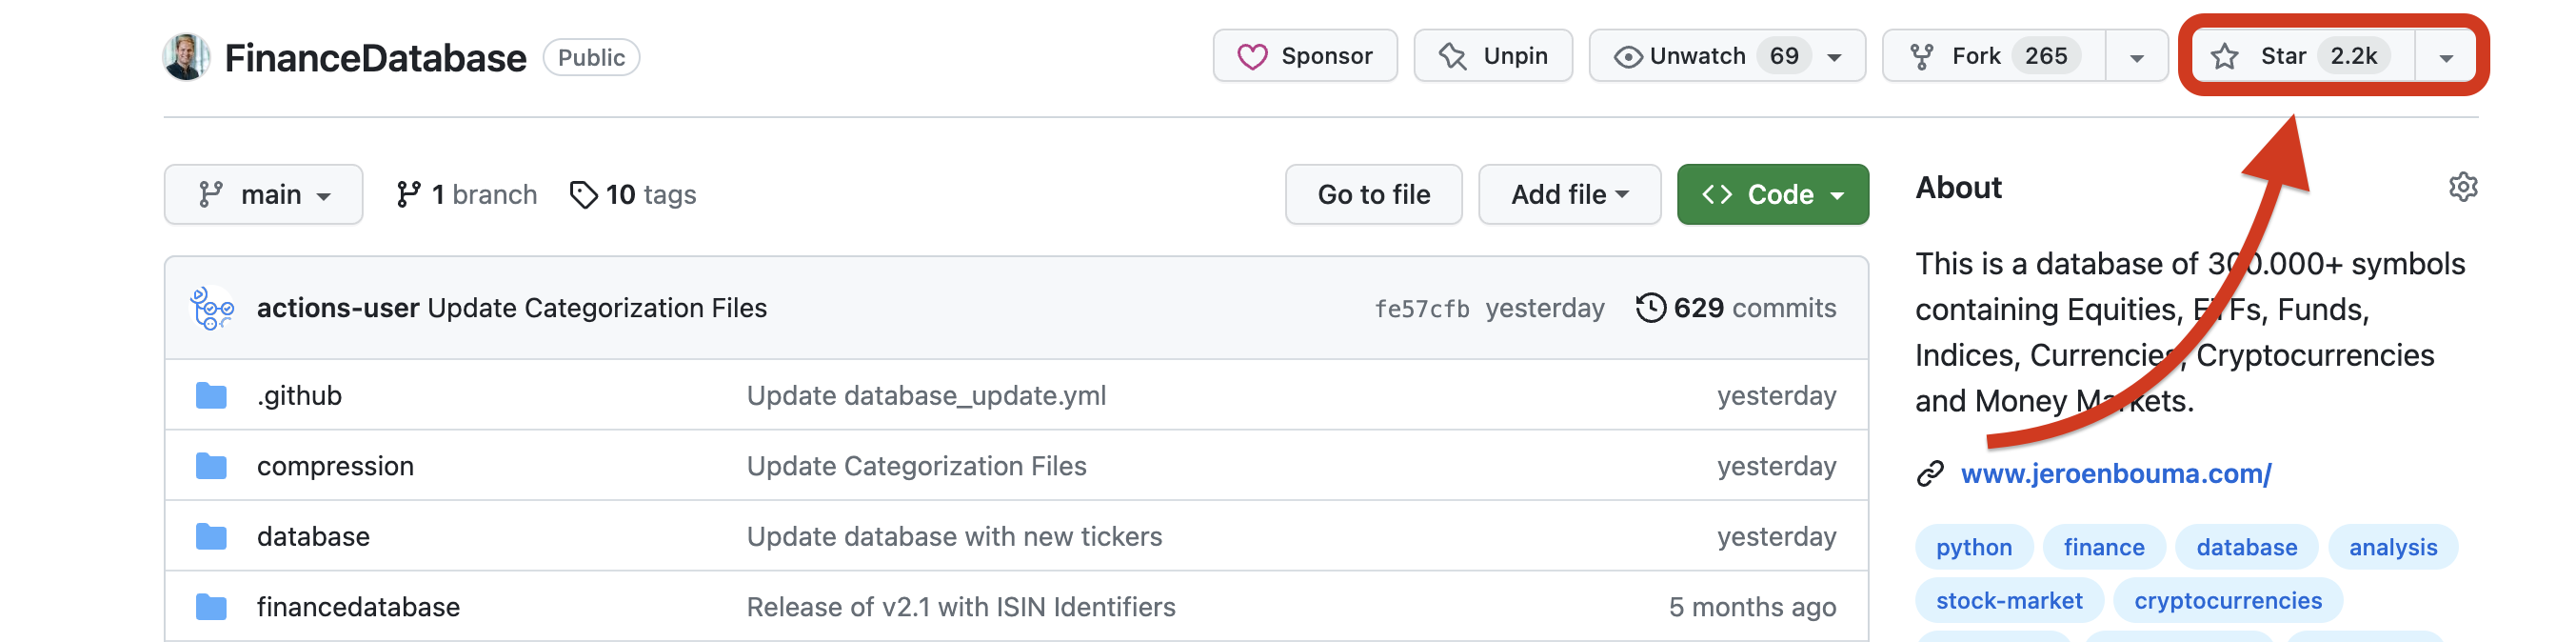
This database tries to solve that. It features 300.000+ symbols containing Equities, ETFs, Funds, Indices, Currencies, Cryptocurrencies and Money Markets. It therefore allows you to obtain a broad overview of sectors, industries, types of investments and much more.
The aim of this database is explicitly not to provide up-to-date fundamentals or stock data as those can be obtained with ease (with the help of this database) by using the Finance Toolkit 🛠️. Instead, it gives insights into the products that exist in each country, industry and sector and gives the most essential information about each product. With this information, you can analyse specific areas of the financial world and/or find a product that is hard to find. See for examples on how you can combine this database, and the earlier mentioned packages the section Examples.
Some key statistics of the database:
| Product | Quantity | Sectors | Industries | Countries | Exchanges |
|---|
| Equities | 158.429 | 12 | 63 | 111 | 83 |
| ETFs | 36.786 | 295 | 22 | 111 | 53 |
| Funds | 57.881 | 1541 | 52 | 111 | 34 |
| Product | Quantity | Category |
|---|
| Currencies | 2.556 | 175 Currencies |
| Cryptocurrencies | 3.367 | 352 Cryptocurrencies |
| Indices | 91.183 | 64 Exchanges |
| Money Markets | 1.367 | 3 Exchanges |
The Finance Database is used within or referenced by:


Table of Contents
- Installation
- Basic Usage
- Quick Start
- Collecting information from the database
- Searching the database extensively
- Storing the database at a different location
- Examples
- Companies in the Netherlands
- Perform a Dupont Analysis on Railroad Companies
- Technical Analysis of Biotech ETFs
- Questions & Answers
- User Contributions
- Contact
Installation
Before installation, consider starring the project on GitHub which helps others find the project as well.
To install the FinanceDatabase it simply requires the following:
pip install financedatabase -U
Then within Python use:
import financedatabase as fd
Basic Usage
This section explains in detail how the database can be queried with the related financedatabase package, also see the Jupyter Notebook in which you can run the examples also demonstrated here. You can find this document here.
Quick Start
Same methods apply to all other asset classes as well. Columns may vary.
import financedatabase as fd
equities = fd.Equities()
equities_countries = equities.options("country")
equities_sectors = equities.options("sector")
equities_industry_groups = equities.options("industry_group")
equities_germany_industries = equities.options("industry", country="Germany")
equities_united_states = equities.select(country="United States")
equities_usa_machinery = equities.select(
country="United States", industry="Machinery"
)
equities_uk_biotech = equities.search(
country="United Kingdom", summary="biotech", exchange="LSE"
)
equities_media_services = equities.search(
industry="Interactive Media & Services",
country="United States",
market_cap=["Large Cap", "Mega Cap"]
)
telecomunication_services = equities.search(
industry="Diversified Telecommunication Services",
country="United States",
market_cap="Mega Cap",
exclude_exchanges=True)
toolkit = telecomunication_services.to_toolkit(
api_key="FINANCIAL_MODELING_PREP_KEY",
start_date="2000-01-01",
progress_bar=False
)
historical_data = toolkit.get_historical_data()
Scroll down below for a more elaborate explanation and detailed examples.
Collecting information from the database
Please see the Jupyter Notebook for an elaborate explanation of each asset class. This includes Equities, ETFs, Funds, Indices, Currencies, Cryptocurrencies and Money Markets.
Find code examples of all Asset Classes in the Jupyter Notebook here.
As an example for Equities, If you wish to collect data from all equities you can use the following:
import financedatabase as fd
equities = fd.Equities()
equities.select()
Which returns the following DataFrame:
| symbol | name | currency | sector | industry_group | industry | exchange | market | country | state | city | zipcode | website | market_cap | isin | cusip | figi | composite_figi | shareclass_figi |
|---|
| A | Agilent Technologies, Inc. | USD | Health Care | Pharmaceuticals, Biotechnology & Life Sciences | Biotechnology | NYQ | New York Stock Exchange | United States | CA | Santa Clara | 95051 | http://www.agilent.com | Large Cap | US00846U1016 | 00846U101 | BBG000C2V541 | BBG000C2V3D6 | BBG001SCTQY4 |
| AA | Alcoa Corporation | USD | Materials | Materials | Metals & Mining | NYQ | New York Stock Exchange | United States | PA | Pittsburgh | 15212-5858 | http://www.alcoa.com | Mid Cap | US0138721065 | 13872106 | BBG00B3T3HK5 | BBG00B3T3HD3 | BBG00B3T3HF1 |
| AAALF | Aareal Bank AG | USD | Financials | Banks | Banks | PNK | OTC Bulletin Board | Germany | nan | Wiesbaden | 65189 | http://www.aareal-bank.com | Small Cap | US00254K1088 | 00254K108 | nan | nan | nan |
| AAALY | Aareal Bank AG | USD | Financials | Banks | Banks | PNK | OTC Bulletin Board | Germany | nan | Wiesbaden | 65189 | http://www.aareal-bank.com | Small Cap | US00254K1088 | 00254K108 | nan | nan | nan |
| AABB | Asia Broadband, Inc. | USD | Materials | Materials | Metals & Mining | PNK | OTC Bulletin Board | United States | NV | Las Vegas | 89135 | http://www.asiabroadbandinc.com | Micro Cap | nan | nan | nan | nan | nan |
This returns approximately 20.000 different equities. Note that by default, only the American exchanges are selected. These are symbols like TSLA (Tesla) and MSFT (Microsoft) that tend to be recognized by a majority of data providers and therefore is the default. To disable this, you can set the exclude_exchanges argument to False which then results in approximately 155,000 different symbols.
Note that the summary column is taken out on purpose to keep it organized for markdown. The summary is however very handy when it comes to querying specific words as found with the following description given for Apple. All of this information is available when you query the database. Find a more elaborate explanation with help(equities.select).
As an example, we can use equities.options to obtain specific country, sector and industry options. For we can acquire all industries within the sector Basic Materials within the United States. This allows us to look at a specific industry in the United States in detail.
industry_options = equities.options(selection='industry', country="United States", sector="Materials")
Which returns:
array(['Chemicals', 'Construction Materials', 'Metals & Mining',
       'Paper & Forest Products'], dtype=object)
So with this information in hand, I can now query the industry Metals & Mining as follows:
metals_and_mining = equities.search(industry="Metals & Mining", country="United States", market_cap="Large Cap", exclude_exchanges=True)

metals_and_mining
This gives you a DataFrame with the following information:
| symbol | name | currency | sector | industry_group | industry | exchange | market | country | state | city | zipcode | website | market_cap | isin | cusip | figi | composite_figi | shareclass_figi |
|---|
| FCX | Freeport-McMoRan Inc. | USD | Materials | Materials | Metals & Mining | NYQ | New York Stock Exchange | United States | AZ | Phoenix | 85004-2189 | http://fcx.com | Large Cap | US35671D8570 | 35671D857 | BBG000BJDCQ6 | BBG000BJDB15 | BBG001S5R3F3 |
| NEM | Newmont Corporation | USD | Materials | Materials | Metals & Mining | NYQ | New York Stock Exchange | United States | CO | Denver | 80237 | http://www.newmont.com | Large Cap | US6516391066 | 651639106 | BBG000BPWYG4 | BBG000BPWXK1 | BBG001S5TKX3 |
| NUE | Nucor Corporation | USD | Materials | Materials | Metals & Mining | NYQ | New York Stock Exchange | United States | NC | Charlotte | 28211 | http://www.nucor.com | Large Cap | US6703461052 | 670346105 | BBG000BQ8MY5 | BBG000BQ8KV2 | BBG001S5TRV0 |
| RS | Reliance Steel & Aluminum Co. | USD | Materials | Materials | Metals & Mining | NYQ | New York Stock Exchange | United States | CA | Los Angeles | 90071 | http://www.rsac.com | Large Cap | US7595091023 | 759509102 | BBG000CJ2332 | BBG000CJ2181 | BBG001S81M27 |
| SCCO | Southern Copper Corporation | USD | Materials | Materials | Metals & Mining | NYQ | New York Stock Exchange | United States | AZ | Phoenix | 85014 | http://www.southerncoppercorp.com | Large Cap | US84265V1052 | 84265V105 | BBG000BSHKK0 | BBG000BSHH72 | BBG001S6ZM88 |
| STLD | Steel Dynamics, Inc. | USD | Materials | Materials | Metals & Mining | NMS | NASDAQ Global Select | United States | IN | Fort Wayne | 46804 | http://www.steeldynamics.com | Large Cap | US8581191009 | 858119100 | BBG000HH03N1 | BBG000HGYNZ9 | BBG001S98JK5 |
As you can imagine, looking at such a specific selection only yields a few results but picking the entire sector Materials would have returned 403 different companies (which excludes exchanges other than the United States).
To conclude, this information can then be send to the Finance Toolkit 🛠️ to obtain 130+ financial metrics, historical and fundamental data with the to_toolkit function. This functionality can be used with any output as obtained from the Finance Database.
companies = metals_and_mining.to_toolkit(
    api_key="FINANCIAL_MODELING_PREP_KEY",
    start_date="2000-01-01",
    quarterly=False)

companies.get_quote()
This returns the following:
| FCX | NEM | NUE | RS | SCCO | STLD |
|---|
| Symbol | FCX | NEM | NUE | RS | SCCO | STLD |
| Price | 38.755 | 40.3007 | 157.54 | 268.06 | 78.3 | 99.49 |
| Beta | 2.065006 | 0.394536 | 1.627593 | 0.923236 | 1.294605 | 1.523167 |
| Average Volume | 10431879 | 7104366 | 1315646 | 265598 | 1031395 | 1277711 |
| Market Capitalization | 55560715720 | 31998755800 | 39183663880 | 15696816226 | 60534353894 | 16479921560 |
| Last Dividend | 0.6000000000000001 | 1.6 | 2.04 | 4 | 4 | 1.7000000000000002 |
| Range | 26.03-46.73 | 37.45-55.41 | 102.86-182.68 | 168.25-295.98 | 42.42-87.59 | 69.12-136.46 |
| Changes | -1.435 | -0.1693 | 2.87 | 4.41 | -1.3599999999999999 | 1.38 |
| Company Name | Freeport-McMoRan Inc. | Newmont Corporation | Nucor Corporation | Reliance Steel & Aluminum Co. | Southern Copper Corporation | Steel Dynamics, Inc. |
| Currency | USD | USD | USD | USD | USD | USD |
| CIK | 831259 | 1164727 | 73309 | 861884 | 1001838 | 1022671 |
| ISIN | US35671D8570 | US6516391066 | US6703461052 | US7595091023 | US84265V1052 | US8581191009 |
| CUSIP | 35671D857 | 651639106 | 670346105 | 759509102 | 84265V105 | 858119100 |
| Exchange | New York Stock Exchange | New York Stock Exchange | New York Stock Exchange | New York Stock Exchange | New York Stock Exchange | NASDAQ Global Select |
| Exchange Short Name | NYSE | NYSE | NYSE | NYSE | NYSE | NASDAQ |
| Industry | Copper | Gold | Steel | Steel | Copper | Steel |
| Website | https://fcx.com | https://www.newmont.com | https://www.nucor.com | https://www.rsac.com | https://www.southernperu.com | https://stld.steeldynamics.com |
| CEO | Mr. Richard C. Adkerson | Mr. Thomas Ronald Palmer | Mr. Leon J. Topalian | Ms. Karla R. Lewis | Mr. Oscar Gonzalez Rocha | Mr. Mark D. Millett |
| Sector | Basic Materials | Basic Materials | Basic Materials | Basic Materials | Basic Materials | Basic Materials |
| Country | US | US | US | US | US | US |
| Full Time Employees | 25600 | 14600 | 31400 | 14500 | 15018 | 12060 |
| Phone | 602 366 8100 | 303 863 7414 | 704 366 7000 | 213 687 7700 | 602 264 1375 | 260 969 3500 |
| Address | 333 North Central Avenue | 6900 East Layton Avenue | 1915 Rexford Road | 350 South Grand Avenue | 1440 East Missouri Avenue | 7575 West Jefferson Boulevard |
| City | Phoenix | Denver | Charlotte | Los Angeles | Phoenix | Fort Wayne |
| State | AZ | CO | NC | CA | AZ | IN |
| ZIP Code | 85004-2189 | 80237 | 28211 | 90071 | 85014 | 46804 |
| DCF Difference | 3.24601 | 2.08 | 9.70759 | 13.6802 | 13.4469 | 9.8176 |
| DCF | 41.574 | 51.24 | 157.162 | 213.01 | 61.1331 | 109.112 |
| IPO Date | 1995-07-10 | 1980-03-17 | 1980-03-17 | 1994-09-16 | 1996-01-05 | 1996-11-22 |
Searching the database extensively
All asset classes have the capability to search each column with search, for example equities.search(). Through how this functionality is developed you can define multiple columns and search throughoutly. For example:
equities = fd.Equities()
equities.search(summary='automotive', currency='USD', country='Germany')
Which returns a selection of the DataFrame that matches all criteria.
| symbol | name | currency | sector | industry_group | industry | exchange | market | country | state | city | zipcode | website | market_cap | isin | cusip | figi | composite_figi | shareclass_figi |
|---|
| AFRMF | Alphaform AG | USD | Industrials | Capital Goods | Machinery | PNK | OTC Bulletin Board | Germany | nan | Feldkirchen | 85622 | nan | Nano Cap | nan | nan | nan | nan | nan |
| AUUMF | Aumann AG | USD | Industrials | Capital Goods | Machinery | PNK | OTC Bulletin Board | Germany | nan | Beelen | 48361 | http://www.aumann.com | Micro Cap | DE000A2DAM03 | nan | nan | nan | nan |
| BAMXF | Bayerische Motoren Werke Aktiengesellschaft | USD | Consumer Discretionary | Automobiles & Components | Automobiles | PNK | OTC Bulletin Board | Germany | nan | Munich | 80788 | http://www.bmwgroup.com | Large Cap | DE0005190037 | nan | nan | nan | nan |
| BASFY | BASF SE | USD | Materials | Materials | Chemicals | PNK | OTC Bulletin Board | Germany | nan | Ludwigshafen am Rhein | 67056 | http://www.basf.com | Large Cap | nan | nan | nan | nan | nan |
| BDRFF | Beiersdorf Aktiengesellschaft | USD | Consumer Staples | Household & Personal Products | Household Products | PNK | OTC Bulletin Board | Germany | nan | Hamburg | 20245 | http://www.beiersdorf.com | Large Cap | US07724U1034 | 07724U103 | nan | nan | nan |
Storing the database at a different location
If you wish to store the database at a different location (for example your own Fork) you can do so with the variable
base_url which you can find in each of the asset classes. An example would be:
fd.Equities(base_url=<YOUR URL>)
You can also store the database locally and point to your local location with the variable base_url and by setting
use_local_location to True. An example would be:
fd.Equities(base_url=<YOUR PATH>, use_local_location=True)
Examples
This section gives a few examples of the possibilities with this package. These are merely a few of the things you can do with the package. As you can obtain a wide range of symbols, pretty much any package that requires symbols should work.
Find a variety of How-To Guides for the FinanceDatabase here.
Companies in the Netherlands
I want to see how many public companies exist in each sector in the Netherlands. Here, I can obtain all stocks that are located in the Netherlands with country='Netherlands'. I also include all exchanges by setting exclude_exchanges=False. This will give me all stocks that are listed on all exchanges. This is relevant because some stocks are listed on exchanges that are not the American exchanges which the parameter defaults to. Find the related Jupyter Notebook with more examples here.
import financedatabase as fd

dutch_companies = equities.select(country='Netherlands', exclude_exchanges=False)
Which returns:
| symbol | name | currency | sector | industry_group | industry | exchange | market | country | state | city | zipcode | website | market_cap | isin | cusip | figi | composite_figi | shareclass_figi |
|---|
| 09B.F | lastminute.com N.V. | EUR | Consumer Discretionary | Consumer Services | Hotels, Restaurants & Leisure | FRA | Frankfurt Stock Exchange | Netherlands | nan | Amsterdam | 1097 JB | http://lmgroup.lastminute.com | Small Cap | nan | nan | nan | nan | nan |
| 0DI7.L | AFC Ajax NV | EUR | nan | nan | nan | LSE | London Stock Exchange (international) | Netherlands | nan | Amsterdam | 1101 AX | http://www.ajax.nl | Micro Cap | NL0000018034 | nan | nan | nan | nan |
| 0DLI.L | Amsterdam Commodities N.V. | EUR | nan | nan | nan | LSE | London Stock Exchange (international) | Netherlands | nan | Rotterdam | 3011 DD | http://www.acomo.nl | Small Cap | nan | nan | nan | nan | nan |
| 0DQK.L | Beter Bed Holding N.V. | EUR | nan | nan | nan | LSE | London Stock Exchange (international) | Netherlands | nan | Uden | 5405 AR | http://www.beterbedholding.com | Micro Cap | NL0000339703 | nan | nan | nan | nan |
| 0E2F.L | Ctac N.V. | EUR | nan | nan | nan | LSE | London Stock Exchange (international) | Netherlands | nan | 's-Hertogenbosch | 5216 TZ | http://www.ctac.nl | Micro Cap | NL0000345577 | nan | nan | nan | nan |
This will return the same company multiple times. That makes sense, since a company can be listed on multiple exchanges. Filtering is applied by grouping by unique names and the sector.
unique_dutch_companies_per_sector = dutch_companies.groupby('sector').agg({'name': 'nunique'})
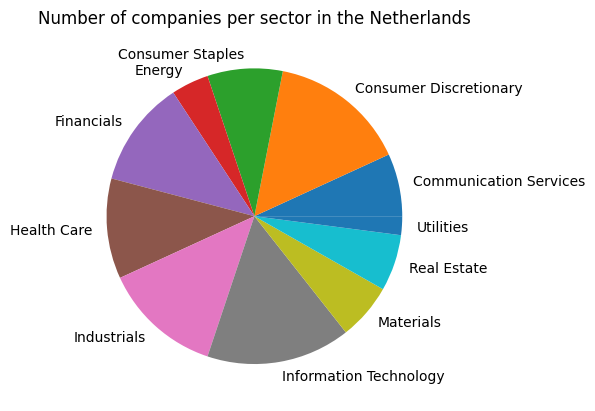
Now with this result, I can plot a pie chart to showcase the distribution of companies in each sector.
unique_dutch_companies_per_sector['name'].plot.pie(
    title='Number of companies per sector in the Netherlands',
    ylabel='',
)
This results in the following graph which gives an indication which sectors are dominant within The Netherlands. Of course this is a mere example and to truly understand the importance of certain companies for the Netherlands, you would need to know market cap of each sector as well including demographics.
Perform a Dupont Analysis on Railroad Companies
A great use-case for the data found in the Finance Database is to do competitive analysis in which companies are compared that compete for the same market. For example, in case I want to look into the Railroad companies in the United States that are marked as "Large Cap", I can directly search for this with the Finance Database and use the Finance Toolkit 🛠️ to do further research. Find the related Jupyter Notebook with more examples here.
import financedatabase as fd

equities = fd.Equities()

railroad = equities.search(industry='Road & Rail',
                           country='United States',
                           market_cap='Large Cap',
                           exclude_exchanges=True)
This gives the following:
| symbol | name | currency | sector | industry_group | industry | exchange | market | country | state | city | zipcode | website | market_cap | isin | cusip | figi | composite_figi | shareclass_figi |
|---|
| CSX | CSX Corporation | USD | Industrials | Transportation | Road & Rail | NMS | NASDAQ Global Select | United States | FL | Jacksonville | 32202 | http://www.csx.com | Large Cap | US1264081035 | 1.26408e+08 | BBG000BGK1N1 | BBG000BGJRC8 | BBG001S5Q7Q3 |
| KSU | Kansas City Southern | USD | Industrials | Transportation | Road & Rail | NYQ | New York Stock Exchange | United States | MO | Kansas City | 64105 | http://www.kcsouthern.com | Large Cap | nan | nan | nan | nan | nan |
| KSU-P | Kansas City Southern | USD | Industrials | Transportation | Road & Rail | NYQ | New York Stock Exchange | United States | MO | Kansas City | 64105 | http://www.kcsouthern.com | Large Cap | nan | nan | nan | nan | nan |
| NSC | Norfolk Southern Corporation | USD | Industrials | Transportation | Road & Rail | NYQ | New York Stock Exchange | United States | VA | Norfolk | 23510-2191 | http://www.norfolksouthern.com | Large Cap | US6558441084 | 6.55844e+08 | BBG000BQ5GM4 | BBG000BQ5DS5 | BBG001S5TQJ6 |
| UNP | Union Pacific Corporation | USD | Industrials | Transportation | Road & Rail | NYQ | New York Stock Exchange | United States | NE | Omaha | 68179 | http://www.up.com | Large Cap | US9078181081 | 9.07818e+08 | BBG000BW3413 | BBG000BW3299 | BBG001S5X2M0 |
| WAB | Westinghouse Air Brake Technologies Corporation | USD | Industrials | Transportation | Road & Rail | NYQ | New York Stock Exchange | United States | PA | Pittsburgh | 15212 | http://www.wabteccorp.com | Large Cap | US9297401088 | 9.2974e+08 | BBG000BDDBD5 | BBG000BDD940 | BBG001S5XBT3 |
With this information in hand, I can now start collecting data with the FinanceToolkit package. This can be anything from balance sheet, cash flow and income statements to 100+ financial ratios, technical indicators and more. Here I initialize the FinanceToolkit with the tickers as found in the Finance Database.
API_KEY = "YOUR_FMP_API_KEY"

companies = railroad.to_toolkit(api_key=API_KEY, start_date='2005-01-01')
Then, as a demonstration, I can obtain all balance sheet statements for all companies that are marked as Large Cap Railroad companies in the United States. To keep this concise, only the first company is shown.
companies.get_balance_sheet_statement().loc['CSX']
Which returns:
| 2005 | 2006 | 2007 | 2008 | 2009 | 2010 | 2011 | 2012 | 2013 | 2014 | 2015 | 2016 | 2017 | 2018 | 2019 | 2020 | 2021 | 2022 |
|---|
| Cash and Cash Equivalents | 3.09e+08 | 4.61e+08 | 3.68e+08 | 6.69e+08 | 1.029e+09 | 1.292e+09 | 7.83e+08 | 7.84e+08 | 5.92e+08 | 6.69e+08 | 6.28e+08 | 6.03e+08 | 4.01e+08 | 8.58e+08 | 9.58e+08 | 3.129e+09 | 2.239e+09 | 1.958e+09 |
| Short Term Investments | 2.93e+08 | 4.39e+08 | 3.46e+08 | 7.6e+07 | 6.1e+07 | 5.4e+07 | 5.23e+08 | 5.87e+08 | 4.87e+08 | 2.92e+08 | 8.1e+08 | 4.17e+08 | 1.8e+07 | 2.53e+08 | 9.96e+08 | 2e+06 | 7.7e+07 | 1.29e+08 |
| Cash and Short Term Investments | 6.02e+08 | 9e+08 | 7.14e+08 | 7.45e+08 | 1.09e+09 | 1.346e+09 | 1.306e+09 | 1.371e+09 | 1.079e+09 | 9.61e+08 | 1.438e+09 | 1.02e+09 | 4.19e+08 | 1.111e+09 | 1.954e+09 | 3.131e+09 | 2.316e+09 | 2.087e+09 |
| Accounts Receivable | 1.202e+09 | 1.174e+09 | 1.174e+09 | 1.107e+09 | 9.95e+08 | 9.93e+08 | 1.129e+09 | 9.62e+08 | 1.052e+09 | 1.129e+09 | 9.82e+08 | 9.38e+08 | 9.7e+08 | 1.01e+09 | 9.86e+08 | 9.12e+08 | 1.148e+09 | 1.313e+09 |
| Inventory | 1.99e+08 | 2.04e+08 | 2.4e+08 | 2.17e+08 | 2.03e+08 | 2.18e+08 | 2.4e+08 | 2.74e+08 | 2.52e+08 | 2.73e+08 | 3.5e+08 | 4.07e+08 | 3.72e+08 | 2.63e+08 | 2.61e+08 | 3.02e+08 | 3.39e+08 | 3.41e+08 |
| Other Current Assets | 1.44e+08 | 1.43e+08 | 1.09e+08 | 1.19e+08 | 1.24e+08 | 1.06e+08 | 7.8e+07 | 1.43e+09 | 1.523e+09 | 1.611e+09 | 1.528e+09 | 1.467e+09 | 1.496e+09 | 1.454e+09 | 1.324e+09 | 1.31e+09 | 1.557e+09 | 1.762e+09 |
| Total Current Assets | 2.372e+09 | 2.672e+09 | 2.491e+09 | 2.391e+09 | 2.57e+09 | 2.855e+09 | 2.935e+09 | 2.801e+09 | 2.602e+09 | 2.572e+09 | 2.966e+09 | 2.487e+09 | 1.915e+09 | 2.565e+09 | 3.278e+09 | 4.441e+09 | 3.873e+09 | 3.849e+09 |
| Property, Plant and Equipment | 2.0163e+10 | 2.0923e+10 | 2.178e+10 | 2.2688e+10 | 2.3213e+10 | 2.3799e+10 | 2.4974e+10 | 2.605e+10 | 2.7291e+10 | 2.8584e+10 | 3.0174e+10 | 3.115e+10 | 3.1764e+10 | 3.1998e+10 | 3.2168e+10 | 3.2444e+10 | 3.3015e+10 | 3.4242e+10 |
| Goodwill | 0 | 0 | 0 | 6.4e+07 | 6.4e+07 | 7e+07 | 6.4e+07 | 6.4e+07 | 6.4e+07 | 6.3e+07 | 6.3e+07 | 6.3e+07 | 6.3e+07 | 0 | 0 | 0 | 2.76e+08 | 3.19e+08 |
| Intangible Assets | 0 | 7.3e+07 | 0 | 0 | 0 | 0 | 0 | 0 | 0 | 0 | 0 | 0 | 0 | 0 | 0 | 0 | 1.75e+08 | 1.83e+08 |
| Long Term Investments | 6.03e+08 | 6.07e+08 | 1.004e+09 | 1.015e+09 | 1.088e+09 | 1.134e+09 | 1.171e+09 | 1.206e+09 | 1.298e+09 | 1.356e+09 | 1.394e+09 | 1.459e+09 | 1.686e+09 | 1.779e+09 | 1.879e+09 | 1.985e+09 | 2.099e+09 | 2.292e+09 |
| Tax Assets | 0 | 0 | 2.54e+08 | 2.03e+08 | -6.4e+07 | 4.74e+08 | 1.82e+08 | 1.19e+08 | 1.55e+08 | 1.41e+08 | 1.26e+08 | 9.596e+09 | 6.418e+09 | 6.69e+09 | 6.961e+09 | 7.168e+09 | -4.51e+08 | 7.569e+09 |
| Other Fixed Assets | 1.094e+09 | 8.54e+08 | 2.59e+08 | -7.3e+07 | 1.65e+08 | -1.91e+08 | 1.47e+08 | 3.31e+08 | 3.72e+08 | 3.37e+08 | 3.16e+08 | -9.341e+09 | -6.107e+09 | 3.87e+08 | 9.32e+08 | 9.23e+08 | 1.544e+09 | -6.542e+09 |
| Fixed Assets | 2.186e+10 | 2.2457e+10 | 2.3043e+10 | 2.3897e+10 | 2.4466e+10 | 2.5286e+10 | 2.6538e+10 | 2.777e+10 | 2.918e+10 | 3.0481e+10 | 3.2073e+10 | 3.2927e+10 | 3.3824e+10 | 3.4164e+10 | 3.4979e+10 | 3.5352e+10 | 3.6658e+10 | 3.8063e+10 |
| Other Assets | 0 | 0 | 0 | 0 | 0 | 0 | 0 | 0 | 0 | 0 | 0 | 0 | 0 | 0 | 0 | 0 | 0 | 0 |
| Total Assets | 2.4232e+10 | 2.5129e+10 | 2.5534e+10 | 2.6288e+10 | 2.7036e+10 | 2.8141e+10 | 2.9473e+10 | 3.0571e+10 | 3.1782e+10 | 3.3053e+10 | 3.5039e+10 | 3.5414e+10 | 3.5739e+10 | 3.6729e+10 | 3.8257e+10 | 3.9793e+10 | 4.0531e+10 | 4.1912e+10 |
| Accounts Payable | 9.54e+08 | 9.74e+08 | 9.76e+08 | 9.73e+08 | 9.67e+08 | 1.046e+09 | 1.147e+09 | 1.014e+09 | 9.57e+08 | 8.45e+08 | 7.64e+08 | 8.06e+08 | 8.47e+08 | 9.49e+08 | 1.043e+09 | 8.09e+08 | 9.63e+08 | 1.13e+09 |
| Short Term Debt | 9.37e+08 | 6e+08 | 7.87e+08 | 3.2e+08 | 1.13e+08 | 6.13e+08 | 5.07e+08 | 7.8e+08 | 5.33e+08 | 2.28e+08 | 2e+07 | 3.31e+08 | 1.9e+07 | 1.8e+07 | 2.45e+08 | 4.01e+08 | 1.81e+08 | 1.51e+08 |
| Tax Payables | 1.02e+08 | 1.14e+08 | 1.13e+08 | 1.25e+08 | 1.12e+08 | 8.5e+07 | 1.29e+08 | 8.5e+07 | 9.1e+07 | 1.63e+08 | 1.08e+08 | 1.29e+08 | 1.57e+08 | 1.06e+08 | 6.9e+07 | 7.3e+07 | 1.34e+08 | 1.11e+08 |
| Deferred Revenue | 6.67e+08 | 6.09e+08 | 5.74e+08 | 5.9e+08 | 4.95e+08 | -1.046e+09 | -1.147e+09 | -1.014e+09 | -9.57e+08 | -8.45e+08 | -7.64e+08 | -8.06e+08 | -8.47e+08 | 1.06e+08 | -1.043e+09 | -8.09e+08 | -9.63e+08 | 7.569e+09 |
| Other Current Liabilities | 4.21e+08 | 3.39e+08 | 3.34e+08 | 5.21e+08 | 2.9e+08 | 1.924e+09 | 2.18e+09 | 1.847e+09 | 1.891e+09 | 1.879e+09 | 1.932e+09 | 1.709e+09 | 1.875e+09 | 8.42e+08 | 1.906e+09 | 1.618e+09 | 2.052e+09 | -6.379e+09 |
| Total Current Liabilities | 2.979e+09 | 2.522e+09 | 2.671e+09 | 2.404e+09 | 1.865e+09 | 2.537e+09 | 2.687e+09 | 2.627e+09 | 2.424e+09 | 2.107e+09 | 1.952e+09 | 2.04e+09 | 1.894e+09 | 1.915e+09 | 2.151e+09 | 2.019e+09 | 2.233e+09 | 2.471e+09 |
| Long Term Debt | 5.093e+09 | 5.362e+09 | 6.47e+09 | 7.512e+09 | 7.895e+09 | 8.051e+09 | 8.734e+09 | 9.052e+09 | 9.022e+09 | 9.514e+09 | 1.0683e+10 | 1.0962e+10 | 1.179e+10 | 1.4739e+10 | 1.5993e+10 | 1.6304e+10 | 1.6185e+10 | 1.7896e+10 |
| Deferred Revenue Non Current | 0 | 8.74e+08 | 0 | 0 | 0 | 0 | 0 | 0 | 0 | 0 | 0 | 0 | 0 | 0 | 0 | 0 | 0 | 0 |
| Deferred Tax Liabilities | 6.082e+09 | 6.11e+09 | 6.096e+09 | 6.235e+09 | 6.585e+09 | 7.053e+09 | 7.601e+09 | 8.096e+09 | 8.662e+09 | 8.858e+09 | 9.305e+09 | 9.596e+09 | 6.418e+09 | 6.69e+09 | 6.961e+09 | 7.168e+09 | 7.383e+09 | 7.569e+09 |
| Other Non Current Liabilities | 2.124e+09 | 1.23e+09 | 1.612e+09 | 2.089e+09 | 1.831e+09 | 1.8e+09 | 1.983e+09 | 1.794e+09 | 1.17e+09 | 1.398e+09 | 1.431e+09 | 1.122e+09 | 9.16e+08 | 8.05e+08 | 1.289e+09 | 1.192e+09 | 1.23e+09 | 1.351e+09 |
| Total Non Current Liabilities | 1.3299e+10 | 1.3576e+10 | 1.4178e+10 | 1.5836e+10 | 1.6311e+10 | 1.6904e+10 | 1.8318e+10 | 1.8942e+10 | 1.8854e+10 | 1.977e+10 | 2.1419e+10 | 2.168e+10 | 1.9124e+10 | 2.2234e+10 | 2.4243e+10 | 2.4664e+10 | 2.4798e+10 | 2.6816e+10 |
| Other Liabilities | 0 | 0 | 0 | 0 | 0 | 0 | 0 | 0 | 0 | 0 | 0 | 0 | 0 | 0 | 0 | 0 | 0 | 0 |
| Capital Lease Obligations | 0 | 0 | 0 | 0 | 0 | 0 | 0 | 0 | 0 | 0 | 0 | 0 | 0 | 0 | 4.93e+08 | 4.55e+08 | 4.78e+08 | 4.88e+08 |
| Total Liabilities | 1.6278e+10 | 1.6098e+10 | 1.6849e+10 | 1.824e+10 | 1.8176e+10 | 1.9441e+10 | 2.1005e+10 | 2.1569e+10 | 2.1278e+10 | 2.1877e+10 | 2.3371e+10 | 2.372e+10 | 2.1018e+10 | 2.4149e+10 | 2.6394e+10 | 2.6683e+10 | 2.7031e+10 | 2.9287e+10 |
| Preferred Stock | 0 | 0 | 0 | -1.824e+10 | 0 | -2.801e+09 | 1.3e+07 | 1.4e+07 | 2.1e+07 | 2.4e+07 | 1.6e+07 | 1.5e+07 | 1.6e+07 | 1.7e+07 | 0 | 0 | 0 | 0 |
| Common Stock | 2.18e+08 | 4.38e+08 | 4.08e+08 | 3.91e+08 | 3.93e+08 | 3.7e+08 | 1.049e+09 | 1.02e+09 | 1.009e+09 | 9.92e+08 | 9.66e+08 | 9.28e+08 | 8.9e+08 | 8.18e+08 | 7.73e+08 | 7.63e+08 | 2.202e+09 | 2.066e+09 |
| Retained Earnings | 6.262e+09 | 7.427e+09 | 8.565e+09 | 8.398e+09 | 9.182e+09 | 9.087e+09 | 8.275e+09 | 8.876e+09 | 9.936e+09 | 1.0734e+10 | 1.1238e+10 | 1.1253e+10 | 1.4084e+10 | 1.2157e+10 | 1.1404e+10 | 1.2527e+10 | 1.163e+10 | 1.0363e+10 |
| Accumulated Other Comprehensive Income | -2.77e+08 | -3.92e+08 | -3.25e+08 | -7.41e+08 | -8.09e+08 | -7.71e+08 | -8.75e+08 | -9.36e+08 | -5.23e+08 | -6.66e+08 | -6.65e+08 | -6.4e+08 | -4.86e+08 | -6.61e+08 | -6.75e+08 | -5.98e+08 | -4.08e+08 | -3.88e+08 |
| Other Total Shareholder Equity | 1.751e+09 | 1.469e+09 | 3.7e+07 | 1.824e+10 | 8e+07 | 2.815e+09 | 6e+06 | 2.8e+07 | 6.1e+07 | 9.2e+07 | 1.13e+08 | 1.38e+08 | 2.17e+08 | 2.49e+08 | 3.61e+08 | 4.18e+08 | 7.6e+07 | 5.84e+08 |
| Total Shareholder Equity | 7.954e+09 | 8.942e+09 | 8.685e+09 | 8.048e+09 | 8.846e+09 | 8.7e+09 | 8.468e+09 | 9.002e+09 | 1.0504e+10 | 1.1176e+10 | 1.1668e+10 | 1.1694e+10 | 1.4721e+10 | 1.258e+10 | 1.1863e+10 | 1.311e+10 | 1.35e+10 | 1.2625e+10 |
| Total Equity | 7.954e+09 | 8.942e+09 | 8.685e+09 | 8.048e+09 | 8.846e+09 | 8.7e+09 | 8.468e+09 | 9.002e+09 | 1.0504e+10 | 1.1176e+10 | 1.1668e+10 | 1.1694e+10 | 1.4721e+10 | 1.258e+10 | 1.1863e+10 | 1.311e+10 | 1.35e+10 | 1.2625e+10 |
| Total Liabilities and Shareholder Equity | 2.4232e+10 | 2.5129e+10 | 2.5534e+10 | 2.6288e+10 | 2.7036e+10 | 2.8155e+10 | 2.9486e+10 | 3.0585e+10 | 3.1803e+10 | 3.3077e+10 | 3.5055e+10 | 3.5429e+10 | 3.5755e+10 | 3.6746e+10 | 3.8272e+10 | 3.9802e+10 | 4.0541e+10 | 4.1922e+10 |
| Minority Interest | 0 | 8.9e+07 | 0 | 0 | 1.4e+07 | 1.4e+07 | 1.3e+07 | 1.4e+07 | 2.1e+07 | 2.4e+07 | 1.6e+07 | 1.5e+07 | 1.6e+07 | 1.7e+07 | 1.5e+07 | 9e+06 | 1e+07 | 1e+07 |
| Total Liabilities and Equity | 2.4232e+10 | 2.5129e+10 | 2.5534e+10 | 2.6288e+10 | 2.7036e+10 | 2.8155e+10 | 2.9486e+10 | 3.0585e+10 | 3.1803e+10 | 3.3077e+10 | 3.5055e+10 | 3.5429e+10 | 3.5755e+10 | 3.6746e+10 | 3.8272e+10 | 3.9802e+10 | 4.0541e+10 | 4.1922e+10 |
| Total Investments | 8.96e+08 | 1.046e+09 | 1.35e+09 | 1.091e+09 | 1.149e+09 | 1.188e+09 | 1.694e+09 | 1.793e+09 | 1.785e+09 | 1.648e+09 | 2.204e+09 | 1.876e+09 | 1.704e+09 | 2.032e+09 | 2.875e+09 | 1.987e+09 | 2.176e+09 | 2.421e+09 |
| Total Debt | 6.03e+09 | 5.962e+09 | 7.257e+09 | 7.832e+09 | 8.008e+09 | 8.664e+09 | 9.241e+09 | 9.832e+09 | 9.555e+09 | 9.742e+09 | 1.0703e+10 | 1.1293e+10 | 1.1809e+10 | 1.4757e+10 | 1.6238e+10 | 1.6705e+10 | 1.6366e+10 | 1.8047e+10 |
| Net Debt | 5.721e+09 | 5.501e+09 | 6.889e+09 | 7.163e+09 | 6.979e+09 | 7.372e+09 | 8.458e+09 | 9.048e+09 | 8.963e+09 | 9.073e+09 | 1.0075e+10 | 1.069e+10 | 1.1408e+10 | 1.3899e+10 | 1.528e+10 | 1.3576e+10 | 1.4127e+10 | 1.6089e+10 |
With the data from the FinanceToolkit, it is now possible to execute a Dupont analysis on all companies. This shows the power of being able to combine a large database with a toolkit that allows you to do proper financial research. Again, only the first company is selected to keep things compact.
companies.models.get_extended_dupont_analysis().loc['CSX']
Which returns:
| 2005 | 2006 | 2007 | 2008 | 2009 | 2010 | 2011 | 2012 | 2013 | 2014 | 2015 | 2016 | 2017 | 2018 | 2019 | 2020 | 2021 | 2022 |
|---|
| Interest Burden Ratio | 1.4961 | 1.1613 | 1.1677 | 1.2898 | 1.2976 | 1.2062 | 1.1835 | 1.1663 | 1.1886 | 1.1869 | 1.1421 | 1.2364 | 1.1671 | 1.1313 | 1.1504 | 1.2026 | 1.1299 | 1.1125 |
| Tax Burden Ratio | 0.7387 | 0.6127 | 0.5922 | 0.4931 | 0.5042 | 0.509 | 0.5331 | 0.5377 | 0.5367 | 0.5334 | 0.5491 | 0.5058 | 1.492 | 0.6796 | 0.6709 | 0.6339 | 0.6759 | 0.6917 |
| Operating Profit Margin | 0.1202 | 0.1925 | 0.1926 | 0.1907 | 0.1948 | 0.2394 | 0.2459 | 0.2521 | 0.243 | 0.2403 | 0.2657 | 0.2476 | 0.2754 | 0.3513 | 0.3616 | 0.3427 | 0.3954 | 0.3645 |
| Asset Turnover | nan | 0.3876 | 0.3959 | 0.4344 | 0.3391 | 0.3855 | 0.4076 | 0.3916 | 0.3857 | 0.3908 | 0.3469 | 0.3142 | 0.3207 | 0.3381 | 0.3184 | 0.2712 | 0.3118 | 0.3603 |
| Equity Multiplier | nan | 2.9215 | 2.8742 | 3.097 | 3.1564 | 3.1447 | 3.3559 | 3.437 | 3.1966 | 2.9905 | 2.9807 | 3.0157 | 2.6937 | 2.6544 | 3.0678 | 3.1254 | 3.0186 | 3.1557 |
| Return on Equity | nan | 0.1551 | 0.1516 | 0.1632 | 0.1364 | 0.1782 | 0.2123 | 0.2128 | 0.1911 | 0.1778 | 0.1723 | 0.1467 | 0.4142 | 0.2424 | 0.2726 | 0.2214 | 0.2842 | 0.3189 |
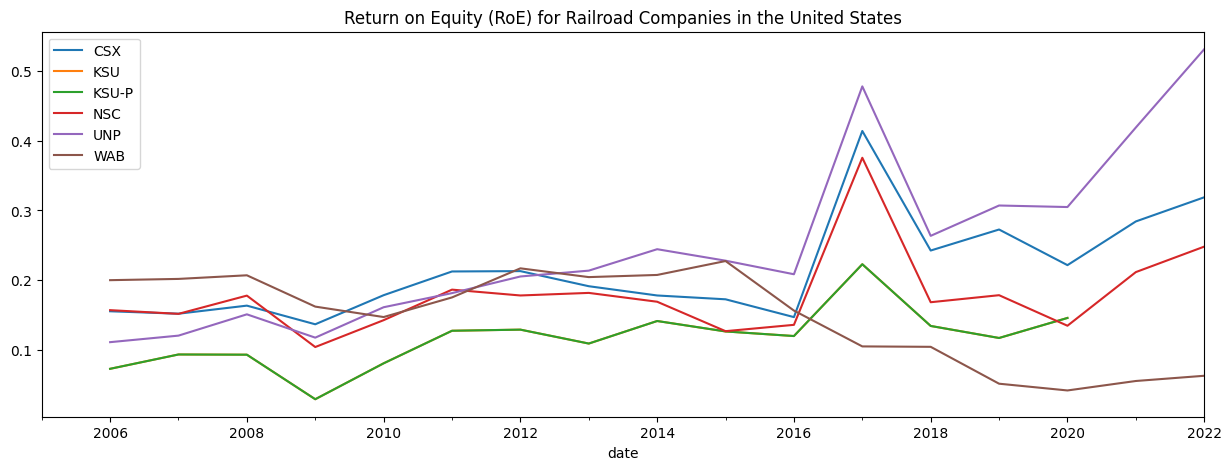
It isn't too difficult to then plot a metric like Return on Equity (RoE) for all companies if you want to delve deeper. You can locate the rows directly from the DuPont Analysis but it is also possible to call the related function.
companies.ratios.get_return_on_equity().T.plot(
    title='Return on Equity (RoE) for Railroad Companies in the United States',
    figsize=(15, 5))
Which returns:
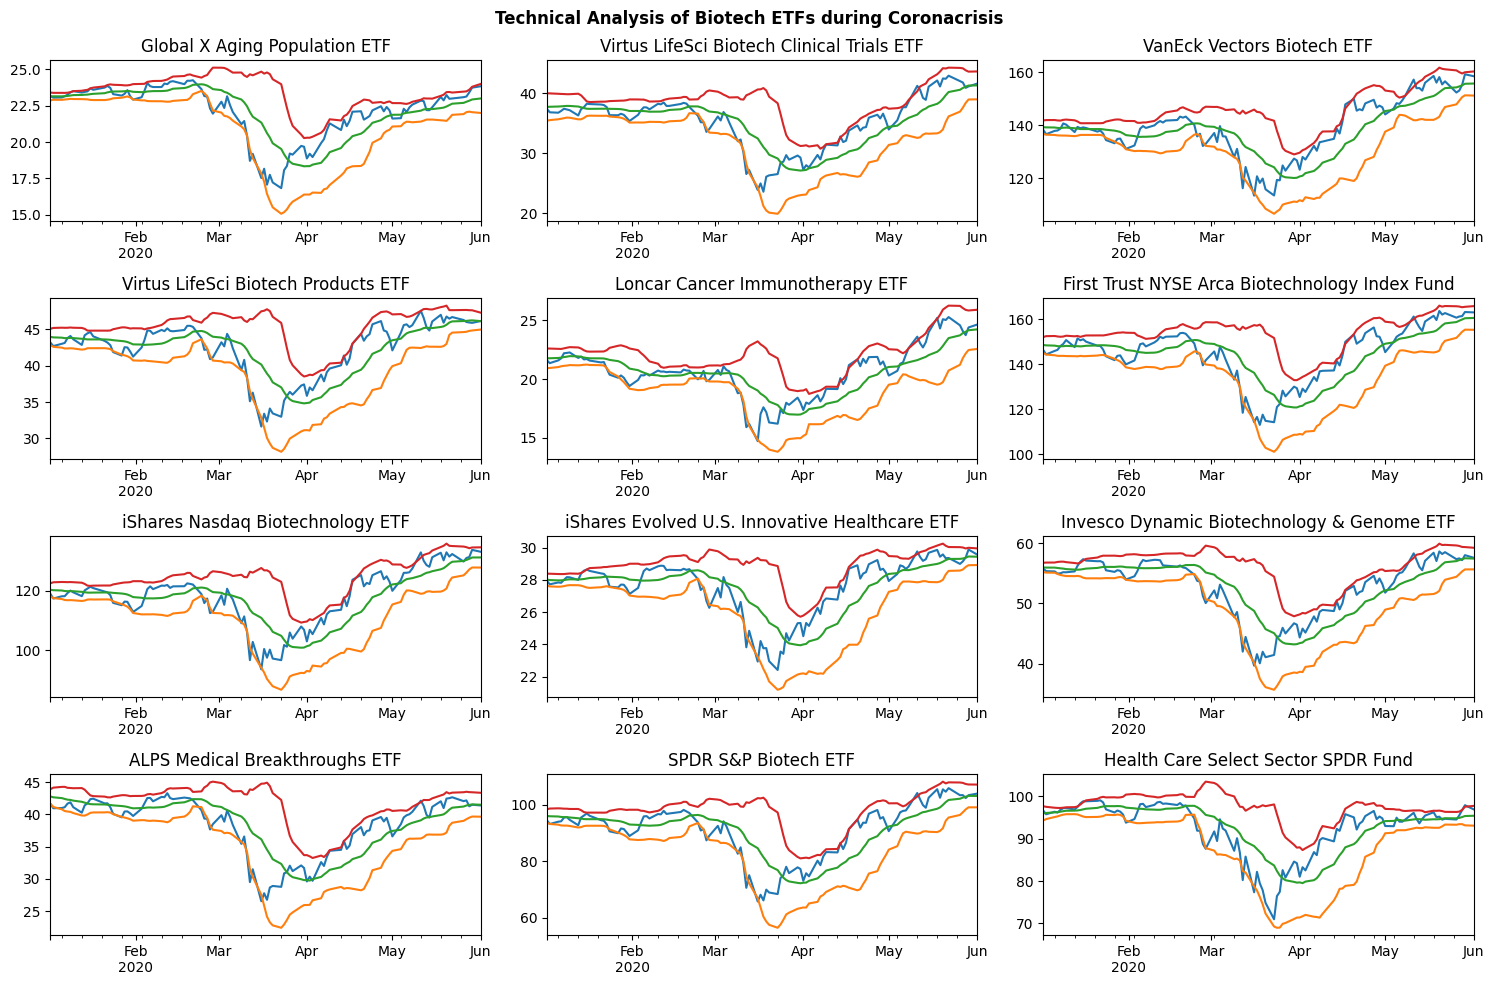
Technical Analysis of Biotech ETFs
In this example I will show how you can use the FinanceDatabase to do a technical analysis of Biotech ETFs during the Coronacrisis. Let's find Health Care ETFs that mention something about 'Biotech' in their description. This would indicate they are related to Biotechnology. Find the related Jupyter Notebook with more examples here.
import financedatabase as fd

API_KEY = "YOUR_FMP_API_KEY"

etfs = fd.ETFs()

health_care_etfs_in_biotech = etfs.search(category='Health Care', summary='biotech', exclude_exchanges=True)
Which returns:
| symbol | name | currency | category_group | category | family | exchange | market |
|---|
| AGNG | Global X Aging Population ETF | USD | Health Care | Health Care | Global X Funds | NMS | us_market |
| BBC | Virtus LifeSci Biotech Clinical Trials ETF | USD | Health Care | Health Care | Virtus | PCX | us_market |
| BBH | VanEck Vectors Biotech ETF | USD | Health Care | Health Care | VanEck Asset Management | NMS | us_market |
| BBP | Virtus LifeSci Biotech Products ETF | USD | Health Care | Health Care | Virtus | PCX | us_market |
| CNCR | Loncar Cancer Immunotherapy ETF | USD | Health Care | Health Care | Loncar Investments | NGM | us_market |
| FBT | First Trust NYSE Arca Biotechnology Index Fund | USD | Health Care | Health Care | First Trust Advisors | PCX | us_market |
| IBB | iShares Nasdaq Biotechnology ETF | USD | Health Care | Health Care | BlackRock Asset Management | NMS | us_market |
| IBBJ | Defiance Nasdaq Junior Biotechnology ETF | USD | Health Care | Health Care | Defiance ETFs | NGM | us_market |
| IBBQ | Invesco Nasdaq Biotechnology ETF | USD | Health Care | Health Care | Invesco Investment Management | NMS | us_market |
| IEIH | iShares Evolved U.S. Innovative Healthcare ETF | USD | Health Care | Health Care | BlackRock Asset Management | BTS | us_market |
| PBE | Invesco Dynamic Biotechnology & Genome ETF | USD | Health Care | Health Care | Invesco Investment Management | PCX | us_market |
| SBIO | ALPS Medical Breakthroughs ETF | USD | Health Care | Health Care | ALPS ETF Trust | PCX | us_market |
| XBI | SPDR S&P Biotech ETF | USD | Health Care | Health Care | State Street Global Advisors | PCX | us_market |
| XLV | Health Care Select Sector SPDR Fund | USD | Health Care | Health Care | State Street Global Advisors | PCX | us_market |
Next up is initializing the Finance Toolkit and obtaining historical data for the chosen tickers. Here a start and end date are also selected that match the period around the initial wave of the Coronacrisis. Then it's time to collect the historical data for each ETF found.
etfs_in_biotech = health_care_etfs_in_biotech.to_toolkit(api_key=API_KEY, start_date="2020-01-01", end_date="2020-06-01")

etfs_in_biotech.get_historical_data()
Which returns (note that this is a MultiIndex):
| Date | ('Open', 'AGNG') | ('Open', 'BBC') | ('Open', 'BBH') | ('Open', 'BBP') | ('Open', 'CNCR') | ('Open', 'FBT') | ('Open', 'IBB') | ('Open', 'IEIH') | ('Open', 'PBE') | ('Open', 'SBIO') | ('Open', 'XBI') | ('Open', 'XLV') | ('High', 'AGNG') | ('High', 'BBC') | ('High', 'BBH') | ('High', 'BBP') | ('High', 'CNCR') | ('High', 'FBT') | ('High', 'IBB') | ('High', 'IEIH') | ('High', 'PBE') | ('High', 'SBIO') | ('High', 'XBI') | ('High', 'XLV') | ('Low', 'AGNG') | ('Low', 'BBC') | ('Low', 'BBH') | ('Low', 'BBP') | ('Low', 'CNCR') | ('Low', 'FBT') | ('Low', 'IBB') | ('Low', 'IEIH') | ('Low', 'PBE') | ('Low', 'SBIO') | ('Low', 'XBI') | ('Low', 'XLV') | ('Close', 'AGNG') | ('Close', 'BBC') | ('Close', 'BBH') | ('Close', 'BBP') | ('Close', 'CNCR') | ('Close', 'FBT') | ('Close', 'IBB') | ('Close', 'IEIH') | ('Close', 'PBE') | ('Close', 'SBIO') | ('Close', 'XBI') | ('Close', 'XLV') | ('Adj Close', 'AGNG') | ('Adj Close', 'BBC') | ('Adj Close', 'BBH') | ('Adj Close', 'BBP') | ('Adj Close', 'CNCR') | ('Adj Close', 'FBT') | ('Adj Close', 'IBB') | ('Adj Close', 'IEIH') | ('Adj Close', 'PBE') | ('Adj Close', 'SBIO') | ('Adj Close', 'XBI') | ('Adj Close', 'XLV') | ('Volume', 'AGNG') | ('Volume', 'BBC') | ('Volume', 'BBH') | ('Volume', 'BBP') | ('Volume', 'CNCR') | ('Volume', 'FBT') | ('Volume', 'IBB') | ('Volume', 'IEIH') | ('Volume', 'PBE') | ('Volume', 'SBIO') | ('Volume', 'XBI') | ('Volume', 'XLV') | ('Dividends', 'AGNG') | ('Dividends', 'BBC') | ('Dividends', 'BBH') | ('Dividends', 'BBP') | ('Dividends', 'CNCR') | ('Dividends', 'FBT') | ('Dividends', 'IBB') | ('Dividends', 'IEIH') | ('Dividends', 'PBE') | ('Dividends', 'SBIO') | ('Dividends', 'XBI') | ('Dividends', 'XLV') | ('Return', 'AGNG') | ('Return', 'BBC') | ('Return', 'BBH') | ('Return', 'BBP') | ('Return', 'CNCR') | ('Return', 'FBT') | ('Return', 'IBB') | ('Return', 'IEIH') | ('Return', 'PBE') | ('Return', 'SBIO') | ('Return', 'XBI') | ('Return', 'XLV') | ('Volatility', 'AGNG') | ('Volatility', 'BBC') | ('Volatility', 'BBH') | ('Volatility', 'BBP') | ('Volatility', 'CNCR') | ('Volatility', 'FBT') | ('Volatility', 'IBB') | ('Volatility', 'IEIH') | ('Volatility', 'PBE') | ('Volatility', 'SBIO') | ('Volatility', 'XBI') | ('Volatility', 'XLV') | ('Excess Return', 'AGNG') | ('Excess Return', 'BBC') | ('Excess Return', 'BBH') | ('Excess Return', 'BBP') | ('Excess Return', 'CNCR') | ('Excess Return', 'FBT') | ('Excess Return', 'IBB') | ('Excess Return', 'IEIH') | ('Excess Return', 'PBE') | ('Excess Return', 'SBIO') | ('Excess Return', 'XBI') | ('Excess Return', 'XLV') | ('Excess Volatility', 'AGNG') | ('Excess Volatility', 'BBC') | ('Excess Volatility', 'BBH') | ('Excess Volatility', 'BBP') | ('Excess Volatility', 'CNCR') | ('Excess Volatility', 'FBT') | ('Excess Volatility', 'IBB') | ('Excess Volatility', 'IEIH') | ('Excess Volatility', 'PBE') | ('Excess Volatility', 'SBIO') | ('Excess Volatility', 'XBI') | ('Excess Volatility', 'XLV') | ('Cumulative Return', 'AGNG') | ('Cumulative Return', 'BBC') | ('Cumulative Return', 'BBH') | ('Cumulative Return', 'BBP') | ('Cumulative Return', 'CNCR') | ('Cumulative Return', 'FBT') | ('Cumulative Return', 'IBB') | ('Cumulative Return', 'IEIH') | ('Cumulative Return', 'PBE') | ('Cumulative Return', 'SBIO') | ('Cumulative Return', 'XBI') | ('Cumulative Return', 'XLV') |
|---|
| 2020-01-02 | 23.59 | 38.47 | 140.44 | 44.18 | 23.62 | 149.6 | 121.3 | 27.7942 | 56.27 | 42.79 | 95.82 | 102.17 | 23.74 | 38.47 | 140.44 | 44.18 | 23.62 | 149.6 | 121.75 | 27.948 | 56.27 | 42.79 | 96.03 | 102.29 | 23.56 | 37.01 | 138.96 | 42.85 | 23.17 | 147.14 | 118.94 | 27.7942 | 55.33 | 41.32 | 93.73 | 101.4 | 23.665 | 37.413 | 139.62 | 43.171 | 23.459 | 148.22 | 119.89 | 27.948 | 55.84 | 41.62 | 94.68 | 102.13 | 23.1607 | 37.413 | 138.222 | 43.171 | 21.6018 | 146.208 | 118.894 | 27.948 | 55.7882 | 41.62 | 94.4506 | 96.6373 | 2400 | 65300 | 15100 | 2900 | 5000 | 324900 | 2.8444e+06 | 2927 | 5400 | 94400 | 3.5886e+06 | 6.2774e+06 | 0 | 0 | 0 | 0 | 0 | 0 | 0 | 0 | 0 | 0 | 0 | 0 | 0 | 0 | 0 | 0 | 0 | 0 | 0 | 0 | 0 | 0 | 0 | 0 | 0.0243617 | 0.0355917 | 0.0250125 | 0.0301117 | 0.0336436 | 0.025867 | 0.0272492 | 0.0228432 | 0.0279196 | 0.0361503 | 0.032811 | 0.0268018 | -0.0143432 | -0.0356187 | -0.0173654 | -0.0270471 | -0.0179894 | -0.022162 | -0.0239449 | -0.019122 | -0.018979 | -0.0344102 | -0.0233211 | -0.0161495 | 0.0248774 | 0.0360896 | 0.0256092 | 0.0305088 | 0.0341735 | 0.0264006 | 0.0277755 | 0.0234134 | 0.0284401 | 0.0365299 | 0.0332703 | 0.0273135 | 1 | 1 | 1 | 1 | 1 | 1 | 1 | 1 | 1 | 1 | 1 | 1 |
| 2020-01-03 | 23.41 | 36.9 | 137.24 | 42.88 | 23.11 | 145.9 | 118.2 | 27.74 | 55.23 | 41.01 | 93.21 | 100.95 | 23.62 | 37.24 | 138.81 | 42.88 | 23.43 | 147.33 | 119.14 | 27.7626 | 55.63 | 41.5 | 94.18 | 101.82 | 23.18 | 34.6 | 137.24 | 42.714 | 23.11 | 145.29 | 117.77 | 27.6172 | 55.15 | 40.68 | 92.7 | 100.45 | 23.555 | 36.84 | 138 | 42.714 | 23.196 | 146.3 | 118.36 | 27.7255 | 55.42 | 40.96 | 93.36 | 101.24 | 23.053 | 36.84 | 136.618 | 42.714 | 21.3596 | 144.314 | 117.376 | 27.7255 | 55.3686 | 40.96 | 93.1338 | 95.7952 | 23700 | 107800 | 26900 | 400 | 7600 | 175100 | 5.4809e+06 | 1937 | 12400 | 91000 | 5.1106e+06 | 8.2475e+06 | 0 | 0 | 0 | 0 | 0 | 0 | 0 | 0 | 0 | 0 | 0 | 0 | -0.00464814 | -0.0153155 | -0.0116029 | -0.0105858 | -0.0112111 | -0.0129537 | -0.0127615 | -0.00796121 | -0.00752148 | -0.0158578 | -0.0139417 | -0.00871437 | 0.0243617 | 0.0355917 | 0.0250125 | 0.0301117 | 0.0336436 | 0.025867 | 0.0272492 | 0.0228432 | 0.0279196 | 0.0361503 | 0.032811 | 0.0268018 | -0.0225481 | -0.0332155 | -0.0295029 | -0.0284858 | -0.0291111 | -0.0308537 | -0.0306615 | -0.0258612 | -0.0254215 | -0.0337578 | -0.0318417 | -0.0266144 | 0.0248774 | 0.0360896 | 0.0256092 | 0.0305088 | 0.0341735 | 0.0264006 | 0.0277755 | 0.0234134 | 0.0284401 | 0.0365299 | 0.0332703 | 0.0273135 | 0.995352 | 0.984685 | 0.988397 | 0.989414 | 0.988789 | 0.987046 | 0.987238 | 0.992039 | 0.992479 | 0.984142 | 0.986058 | 0.991286 |
| 2020-01-06 | 23.242 | 36.57 | 137.05 | 42.3 | 23.1 | 145.47 | 117.69 | 27.76 | 55.26 | 40.54 | 92.76 | 100.78 | 23.61 | 36.81 | 139.32 | 43.025 | 23.45 | 147.89 | 119.18 | 27.8415 | 55.38 | 40.992 | 94.21 | 101.9 | 23.242 | 35.72 | 137.05 | 42.07 | 22.94 | 144.9 | 116.95 | 27.76 | 54.86 | 40.04 | 91.83 | 100.75 | 23.565 | 36.77 | 139.29 | 43.025 | 23.45 | 147.89 | 119.12 | 27.8415 | 55.38 | 40.99 | 94.17 | 101.87 | 23.0628 | 36.77 | 137.896 | 43.025 | 21.5935 | 145.882 | 118.13 | 27.8415 | 55.3286 | 40.99 | 93.9419 | 96.3913 | 1800 | 35300 | 15700 | 5100 | 10600 | 92600 | 2.1991e+06 | 248 | 8100 | 89100 | 3.3645e+06 | 6.4418e+06 | 0 | 0 | 0 | 0 | 0 | 0 | 0 | 0 | 0 | 0 | 0 | 0 | 0.000424587 | -0.00190011 | 0.0093477 | 0.00728101 | 0.0109503 | 0.010868 | 0.00642103 | 0.00418384 | -0.000721745 | 0.000732495 | 0.00867616 | 0.00622281 | 0.0243617 | 0.0355917 | 0.0250125 | 0.0301117 | 0.0336436 | 0.025867 | 0.0272492 | 0.0228432 | 0.0279196 | 0.0361503 | 0.032811 | 0.0268018 | -0.0176754 | -0.0200001 | -0.0087523 | -0.010819 | -0.00714974 | -0.00723197 | -0.011679 | -0.0139162 | -0.0188217 | -0.0173675 | -0.00942384 | -0.0118772 | 0.0248774 | 0.0360896 | 0.0256092 | 0.0305088 | 0.0341735 | 0.0264006 | 0.0277755 | 0.0234134 | 0.0284401 | 0.0365299 | 0.0332703 | 0.0273135 | 0.995774 | 0.982814 | 0.997636 | 0.996618 | 0.999616 | 0.997774 | 0.993578 | 0.996189 | 0.991762 | 0.984863 | 0.994613 | 0.997454 |
| 2020-01-07 | 23.69 | 36.85 | 138.87 | 42.796 | 23.51 | 147.76 | 119.16 | 27.8 | 55.2 | 41.29 | 94.49 | 101.59 | 23.81 | 37.29 | 139.69 | 43.142 | 23.661 | 148.6 | 119.64 | 27.85 | 55.2 | 41.362 | 94.73 | 101.76 | 23.64 | 36.44 | 138.86 | 42.585 | 23.34 | 146.72 | 117.96 | 27.8 | 54.95 | 40.31 | 92.98 | 101.1 | 23.651 | 37.068 | 139.42 | 43.142 | 23.632 | 148.37 | 119.15 | 27.8193 | 55.02 | 41.12 | 94.32 | 101.67 | 23.147 | 37.068 | 138.024 | 43.142 | 21.7611 | 146.356 | 118.16 | 27.8193 | 54.969 | 41.12 | 94.0915 | 96.202 | 10600 | 27200 | 7400 | 2500 | 26900 | 93100 | 1.7184e+06 | 2070 | 3400 | 61700 | 3.9548e+06 | 6.3353e+06 | 0 | 0 | 0 | 0 | 0 | 0 | 0 | 0 | 0 | 0 | 0 | 0 | 0.00364951 | 0.00810446 | 0.000933265 | 0.00271926 | 0.00776119 | 0.00324564 | 0.000251689 | -0.000797335 | -0.00650052 | 0.00317143 | 0.00159277 | -0.00196339 | 0.0243617 | 0.0355917 | 0.0250125 | 0.0301117 | 0.0336436 | 0.025867 | 0.0272492 | 0.0228432 | 0.0279196 | 0.0361503 | 0.032811 | 0.0268018 | -0.0146505 | -0.0101955 | -0.0173667 | -0.0155807 | -0.0105388 | -0.0150544 | -0.0180483 | -0.0190973 | -0.0248005 | -0.0151286 | -0.0167072 | -0.0202634 | 0.0248774 | 0.0360896 | 0.0256092 | 0.0305088 | 0.0341735 | 0.0264006 | 0.0277755 | 0.0234134 | 0.0284401 | 0.0365299 | 0.0332703 | 0.0273135 | 0.999409 | 0.990779 | 0.998567 | 0.999328 | 1.00737 | 1.00101 | 0.993828 | 0.995395 | 0.985315 | 0.987987 | 0.996198 | 0.995496 |
| 2020-01-08 | 23.51 | 36.84 | 139.01 | 43.27 | 23.66 | 148.24 | 119.07 | 28.0052 | 54.83 | 41.17 | 94.23 | 101.72 | 23.823 | 37.431 | 141.01 | 43.937 | 24.19 | 150.56 | 120.88 | 28.0052 | 55.25 | 41.85 | 95.99 | 102.79 | 23.51 | 36.69 | 139.01 | 43.27 | 23.66 | 148.24 | 118.86 | 28.0052 | 54.83 | 40.951 | 93.89 | 101.68 | 23.763 | 37.43 | 140.12 | 43.818 | 24.11 | 150.07 | 120.22 | 28.0052 | 55.07 | 41.68 | 95.61 | 102.33 | 23.2566 | 37.43 | 138.717 | 43.818 | 22.2012 | 148.033 | 119.221 | 28.0052 | 55.0189 | 41.68 | 95.3784 | 96.8266 | 2200 | 87200 | 23000 | 2100 | 23400 | 66600 | 3.3882e+06 | 230 | 12000 | 49300 | 3.0882e+06 | 7.4947e+06 | 0 | 0 | 0 | 0 | 0 | 0 | 0 | 0 | 0 | 0 | 0 | 0 | 0.00473552 | 0.00976581 | 0.00502081 | 0.0156693 | 0.0202269 | 0.011458 | 0.00898025 | 0.00668238 | 0.000908676 | 0.0136187 | 0.0136769 | 0.00649166 | 0.0243617 | 0.0355917 | 0.0250125 | 0.0301117 | 0.0336436 | 0.025867 | 0.0272492 | 0.0228432 | 0.0279196 | 0.0361503 | 0.032811 | 0.0268018 | -0.0139645 | -0.00893419 | -0.0136792 | -0.00303074 | 0.00152691 | -0.00724201 | -0.00971975 | -0.0120176 | -0.0177913 | -0.0050813 | -0.00502309 | -0.0122083 | 0.0248774 | 0.0360896 | 0.0256092 | 0.0305088 | 0.0341735 | 0.0264006 | 0.0277755 | 0.0234134 | 0.0284401 | 0.0365299 | 0.0332703 | 0.0273135 | 1.00414 | 1.00045 | 1.00358 | 1.01499 | 1.02775 | 1.01248 | 1.00275 | 1.00205 | 0.986211 | 1.00144 | 1.00982 | 1.00196 |
Then, let's calculate the Bollinger Bands for each ETF.
bollinger_bands = etfs_in_biotech.technicals.get_bollinger_bands()
Which returns (note that this is a MultiIndex):
| Date | ('Close', 'AGNG') | ('Close', 'BBC') | ('Close', 'BBH') | ('Close', 'BBP') | ('Close', 'CNCR') | ('Close', 'FBT') | ('Close', 'IBB') | ('Close', 'IEIH') | ('Close', 'PBE') | ('Close', 'SBIO') | ('Close', 'XBI') | ('Close', 'XLV') | ('Lower Band', 'AGNG') | ('Lower Band', 'BBC') | ('Lower Band', 'BBH') | ('Lower Band', 'BBP') | ('Lower Band', 'CNCR') | ('Lower Band', 'FBT') | ('Lower Band', 'IBB') | ('Lower Band', 'IEIH') | ('Lower Band', 'PBE') | ('Lower Band', 'SBIO') | ('Lower Band', 'XBI') | ('Lower Band', 'XLV') | ('Middle Band', 'AGNG') | ('Middle Band', 'BBC') | ('Middle Band', 'BBH') | ('Middle Band', 'BBP') | ('Middle Band', 'CNCR') | ('Middle Band', 'FBT') | ('Middle Band', 'IBB') | ('Middle Band', 'IEIH') | ('Middle Band', 'PBE') | ('Middle Band', 'SBIO') | ('Middle Band', 'XBI') | ('Middle Band', 'XLV') | ('Upper Band', 'AGNG') | ('Upper Band', 'BBC') | ('Upper Band', 'BBH') | ('Upper Band', 'BBP') | ('Upper Band', 'CNCR') | ('Upper Band', 'FBT') | ('Upper Band', 'IBB') | ('Upper Band', 'IEIH') | ('Upper Band', 'PBE') | ('Upper Band', 'SBIO') | ('Upper Band', 'XBI') | ('Upper Band', 'XLV') |
|---|
| 2020-01-02 | 23.1607 | 37.413 | 138.222 | 43.171 | 21.6018 | 146.208 | 118.894 | 27.948 | 55.7882 | 41.62 | 94.4506 | 96.6373 | 22.8653 | 35.44 | 136.692 | 42.8394 | 20.9387 | 144.953 | 118.097 | 27.6492 | 55.2137 | 41.6414 | 93.6136 | 94.3335 | 23.1337 | 37.7297 | 139.265 | 43.9656 | 21.7711 | 148.507 | 120.299 | 28.0172 | 55.988 | 42.7784 | 95.9705 | 96.0125 | 23.4021 | 40.0195 | 141.837 | 45.0918 | 22.6036 | 152.06 | 122.502 | 28.3852 | 56.7623 | 43.9154 | 98.3274 | 97.6915 |
| 2020-01-03 | 23.053 | 36.84 | 136.619 | 42.714 | 21.3596 | 144.314 | 117.376 | 27.7255 | 55.3686 | 40.96 | 93.1338 | 95.7952 | 22.9084 | 35.5338 | 136.455 | 42.6106 | 20.9476 | 144.258 | 117.511 | 27.5954 | 55.1277 | 41.156 | 93.1465 | 94.6536 | 23.145 | 37.7597 | 139.214 | 43.9066 | 21.7739 | 148.348 | 120.167 | 27.989 | 55.9616 | 42.6531 | 95.8665 | 96.1042 | 23.3815 | 39.9857 | 141.972 | 45.2026 | 22.6002 | 152.439 | 122.823 | 28.3826 | 56.7955 | 44.1502 | 98.5864 | 97.5548 |
| 2020-01-06 | 23.0628 | 36.77 | 137.895 | 43.025 | 21.5935 | 145.882 | 118.13 | 27.8415 | 55.3286 | 40.99 | 93.9419 | 96.3913 | 22.9012 | 35.679 | 136.329 | 42.4918 | 21.0242 | 143.947 | 117.204 | 27.5757 | 55.1102 | 40.7901 | 92.8938 | 95.1474 | 23.1413 | 37.8004 | 139.162 | 43.8646 | 21.7994 | 148.23 | 120.064 | 27.9694 | 55.9573 | 42.5292 | 95.7817 | 96.2431 | 23.3815 | 39.9219 | 141.995 | 45.2374 | 22.5746 | 152.512 | 122.923 | 28.3632 | 56.8044 | 44.2684 | 98.6695 | 97.3388 |
| 2020-01-07 | 23.147 | 37.068 | 138.024 | 43.142 | 21.7611 | 146.356 | 118.16 | 27.8193 | 54.969 | 41.12 | 94.0915 | 96.202 | 22.924 | 35.7637 | 136.179 | 42.3802 | 21.0897 | 143.686 | 116.878 | 27.5851 | 54.9026 | 40.5252 | 92.6191 | 95.2938 | 23.1513 | 37.8291 | 139.007 | 43.8016 | 21.8268 | 147.994 | 119.889 | 27.9727 | 55.8995 | 42.4004 | 95.6228 | 96.2957 | 23.3787 | 39.8946 | 141.834 | 45.223 | 22.5639 | 152.301 | 122.901 | 28.3602 | 56.8965 | 44.2756 | 98.6264 | 97.2975 |
| 2020-01-08 | 23.2566 | 37.43 | 138.717 | 43.818 | 22.2012 | 148.032 | 119.221 | 28.0052 | 55.0189 | 41.68 | 95.3784 | 96.8266 | 22.9437 | 35.8584 | 136.136 | 42.3848 | 21.1318 | 143.658 | 116.803 | 27.6124 | 54.7366 | 40.4473 | 92.5768 | 95.5192 | 23.1671 | 37.8677 | 138.958 | 43.806 | 21.8742 | 147.913 | 119.835 | 27.9873 | 55.8396 | 42.286 | 95.5601 | 96.4002 | 23.3905 | 39.877 | 141.78 | 45.2272 | 22.6166 | 152.167 | 122.867 | 28.3621 | 56.9425 | 44.1247 | 98.5433 | 97.2811 |
Then, it's time to visually depict the Bollinger Bands for each ETF during the early stages of the Coronacrisis.
from matplotlib import pyplot as plt

figure, axis = plt.subplots(4, 3)
figure.set_size_inches(15, 10)
row = 0
column = 0

for ticker in bollinger_bands.columns.get_level_values(1).unique():
    name = health_care_etfs_in_biotech.loc[health_care_etfs_in_biotech.index == ticker, 'name'].iloc[0]

    bollinger_bands.xs(ticker, level=1, axis=1).plot(
        ax=axis[row, column],
        xlabel='',
        title=name,
        legend=False
        )

    column += 1
    if column == 3:
        row += 1
        column = 0

figure.suptitle('Technical Analysis of Biotech ETFs during the Coronacrisis', fontweight='bold')

figure.tight_layout()
This leads to the following graph which gives an indication of whether Biotech ETFs were oversold or overbought and how this effect is neutralised (to some degree) in the months after. Read more about the Bollinger Bands here.
Questions & Answers
In this section you can find answers to commonly asked questions. In case the answer to your question is not here,
consider creating an Issue.
- How is the data obtained?
- The data is an aggregation of a variety of sources. The rule that I hold with high regard is that all data needs to be entirely publicly available. Any data that requires API key access or requires a paid tier is never included in this database. Data that you are being charged for is often owned and maintained by the company you have a subscription at and therefore publicly sharing this information online is against their Terms of Service (ToS). However, data that is publicly available can freely be shared (read more about this subject here) especially since this database will never cost any money.
- What categorization method is used?
- The categorization for Equities is based on a loose approximation of GICS. No actual data is collected from this source and this database merely tries to reflect the sectors and industries as best as possible. This is completely done through manual curation. The actual datasets as curated by MSCI has not been used in the development of any part of this database and remain the most up to date, paid, solution. Other categorizations are entirely developed by the author and can freely be changed.
- How can I contribute?
- How can I find out which countries, sectors and/or industries exist within the database without needing to check the database manually?
- For this you can use the
options function from the package attached to this database. Furthermore, it is also possible to use equities = fd.Equities() and then use equities.options(selection='country') or specific further with equities.options(selection='sector', country='United States'). Please see
this example
- When I try collect data I notice that not all tickers return output, why is that?
- Some tickers are merely holdings of companies and therefore do not really have any data attached to them.
Therefore, it makes sense that not all tickers return data. If you are still in doubt, search the ticker on
Google to see if there is really no data available. If you can't find anything about the ticker, consider updating the database by visiting the Contributing Guidelines.
- How does the database handle changes to companies over time - like symbol/exchange migration, mergers, bankruptcies, or symbols getting reused?
- For the American Exchanges, every Sunday the database automatically updates based on this repository. It also automatically checks if there were any market cap changes and converts assets accordingly. On purpose, most tickers are not removed even after becoming delisted. This is because it can be still of value for research to look into companies that no longer exist. When it comes to further automisation, this is what you usually pay a hefty fee for, think of Bloomberg at over $25.000 a year. Instead of requiring you to pay, this database is meant to be a community-driven project in which you help in identifying these companies. As news about migrations, mergers, bankruptcies and similar occur outside of the American exchanges it is up to the community to identify these and/or users to look into writing scripts that help with this. It is important to note that the vast majority of companies do not change as rapidly that this database becomes irrelevant before it is identified, e.g. a company like Facebook changing to META has already been updated. Furthermore, even though a company goes bankrupt, the old ticker is still relevant when it comes to historical data before the bankruptcy.
User Contributions
This section is meant to thank those that contributed to the project. Looking to contribute as well? Have a look here.
| User | Contribution |
|---|
| desaijimmy | Made changes to Equities dataset including the Split of Daimler to Mercedes-Benz and Daimler Trucks |
| nindogo | Introduced a variety of new equities from the Nairobi Securities Exchange and introduced the country Kenya into the dataset. |
| colin99d | Helped in the conversion of the Finance Database package to Object-Orientated, making the code much more efficient. |
Contact
If you have any questions about the FinanceDatabase or would like to share with me what you have been working on, feel free to reach out to me via:
f you'd like to support my efforts, either help me out via the Contributing Guidelines or Buy me a Coffee.