

Company News
AWS Security Hub Adds Socket for Supply Chain Security
Socket is now in the AWS Security Hub Extended plan. Adopt it through AWS, apply committed spend, and block malicious open source packages.
By Feross Aboukhadijeh - Aug 04, 2026
kibana-mcp
Advanced tools
MCP server for Kibana / Elasticsearch — log search, aggregations, index discovery, dashboards.



MCP server for Kibana / Elasticsearch — log search, aggregations, index discovery, and dashboard browsing via Claude and any MCP-compatible agent.
Existing integrations require a running Kibana instance with browser-level credentials and often wrap the Kibana UI rather than the stable REST APIs. This server:
outputSchema) and markdown text so it works with any MCP clientreadOnlyHint: true, no data is modified| Tool | API | Description |
|---|---|---|
kibana_list_indices | GET ES/_cat/indices | Discover available indices with health, docs, size |
kibana_search_logs | POST ES/{index}/_search | Full-text log search with time range, sort, size |
kibana_aggregate_logs | POST ES/{index}/_search | Terms grouping with count/avg/sum/min/max metric |
kibana_list_dashboards | GET Kibana/api/saved_objects/_find | List saved dashboards with search + pagination |
kibana_get_dashboard | GET Kibana/api/saved_objects/dashboard/{id} | Fetch one dashboard with panel breakdown |
pip install kibana-mcp
Or run directly with uvx:
uvx kibana-mcp
| Variable | Required | Description |
|---|---|---|
KIBANA_URL | Yes | Kibana base URL (e.g. https://kibana.example.com) |
ELASTICSEARCH_URL | No | Direct ES endpoint. If unset, ES requests go through Kibana Console proxy |
KIBANA_API_KEY | No | ES API key (ApiKey base64(id:api_key) format). Recommended for agents |
KIBANA_USERNAME | No | HTTP Basic auth username (used if API key not set) |
KIBANA_PASSWORD | No | HTTP Basic auth password |
KIBANA_SSL_VERIFY | No | true (default) or false for self-signed certificates |
Auth priority: ApiKey > Basic > anonymous.
Copy .env.example to .env and fill in your values.
{
  "mcpServers": {
    "kibana": {
      "command": "uvx",
      "args": ["kibana-mcp"],
      "env": {
        "KIBANA_URL": "https://kibana.example.com",
        "KIBANA_API_KEY": "your-api-key-here"
      }
    }
  }
}
Or with direct ES access for better performance:
{
  "mcpServers": {
    "kibana": {
      "command": "uvx",
      "args": ["kibana-mcp"],
      "env": {
        "KIBANA_URL": "https://kibana.example.com",
        "ELASTICSEARCH_URL": "https://es.example.com:9200",
        "KIBANA_API_KEY": "your-api-key-here"
      }
    }
  }
}
docker run --rm -i \
  -e KIBANA_URL=https://kibana.example.com \
  -e KIBANA_API_KEY=your-key \
  ghcr.io/mshegolev/kibana-mcp
Find the last 50 ERROR logs from the API service in the last hour
→ kibana_search_logs(index="logs-*", query="level:ERROR AND service:api", size=50, time_from="2026-04-18T09:00:00Z")
Show 500 HTTP errors sorted oldest first for incident replay
→ kibana_search_logs(index="nginx-*", query="status:500", sort_order="asc", size=100)
How many logs per log level in the last hour?
→ kibana_aggregate_logs(index="logs-*", group_by="level", time_from="2026-04-18T09:00:00Z")
What is the average response time per service?
→ kibana_aggregate_logs(index="logs-*", group_by="service.keyword", metric="avg", metric_field="response_time_ms")
What log indices are available?
→ kibana_list_indices()
Show me all filebeat indices
→ kibana_list_indices(pattern="filebeat-*")
Find the infrastructure dashboard
→ kibana_list_dashboards(search="infrastructure")
What panels does dashboard X have?
→ kibana_get_dashboard(dashboard_id="<id from list_dashboards>")
kibana_search_logs): typically 50-500ms with direct ES URL; add 100-200ms when routing through Kibana Console proxykibana_aggregate_logs): size:0 queries — no hits transferred, usually 10-100ms_cat/indices call, O(index_count) response, typically <100msELASTICSEARCH_URL directly if your agent does frequent log searches — eliminates the proxy overheadgit clone https://github.com/mshegolev/kibana-mcp
cd kibana-mcp
pip install -e '.[dev]'
pytest tests/ -v
ruff check src tests
ruff format src tests
MIT — see LICENSE.
FAQs
MCP server for Kibana / Elasticsearch — log search, aggregations, index discovery, dashboards.
The pypi package kibana-mcp receives a total of 146 weekly downloads. As such, kibana-mcp popularity was classified as not popular.
We found that kibana-mcp demonstrated a healthy version release cadence and project activity because the last version was released less than a year ago. It has 1 open source maintainer collaborating on the project.
Did you know?

Socket for GitHub automatically highlights issues in each pull request and monitors the health of all your open source dependencies. Discover the contents of your packages and block harmful activity before you install or update your dependencies.
Company News
Socket is now in the AWS Security Hub Extended plan. Adopt it through AWS, apply committed spend, and block malicious open source packages.
Research
/Security News
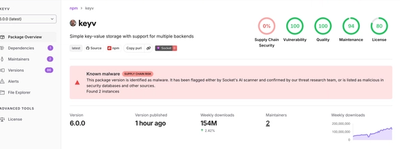
Popular npm packages keyv and cacheable compromised.

Security News
A misconfiguration gave three Anthropic models internet access, and one, believing it was in a simulation, shipped a credential-stealing package to PyPI.