Product
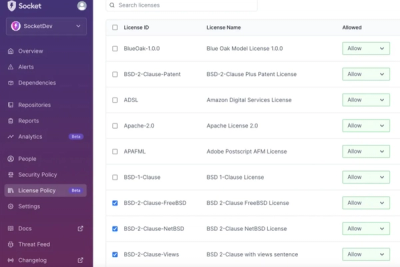
Introducing License Enforcement in Socket
Ensure open-source compliance with Socket’s License Enforcement Beta. Set up your License Policy and secure your software!
By Philipp Burckhardt - Oct 17, 2024
A command-line utility for rendering quick-and-dirty graphs of STDIN input.
.. figure:: https://cloud.githubusercontent.com/assets/4467604/6364493/ce8e79d0-bc74-11e4-8da2-156426b6d936.png :alt: Some sample graphs generated with livechart.
installation
Tested against Python 2.7.
::
sudo pip install livechart
usage
~~~~~
Pipe lines containing either JSON-serialized objects or numbers into
``livechart``; the data *must* be consistent for the duration of usage. Input
like ``{"a": 1, "b": 3, "c": 5}`` will result in three graphs, while ``1.00``
will plot just one.
::
some_script | livechart
Run ``livechart --help`` for all configuration options.
FAQs
A CLI utility for charting data on the fly.
We found that livechart demonstrated a healthy version release cadence and project activity because the last version was released less than a year ago. It has 1 open source maintainer collaborating on the project.
Did you know?

Socket for GitHub automatically highlights issues in each pull request and monitors the health of all your open source dependencies. Discover the contents of your packages and block harmful activity before you install or update your dependencies.
Product
Ensure open-source compliance with Socket’s License Enforcement Beta. Set up your License Policy and secure your software!
Product
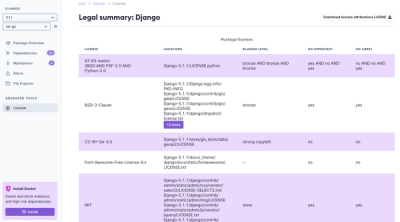
We're launching a new set of license analysis and compliance features for analyzing, managing, and complying with licenses across a range of supported languages and ecosystems.
Product
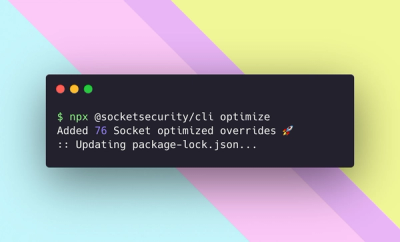
We're excited to introduce Socket Optimize, a powerful CLI command to secure open source dependencies with tested, optimized package overrides.