
Product
Introducing Socket MCP for Claude Desktop
Add secure dependency scanning to Claude Desktop with Socket MCP, a one-click extension that keeps your coding conversations safe from malicious packages.
By Alexandros Kapravelos - Jul 29, 2025
With this library, you can create static .html files with text and charts taking advantage of Google Charts API.
Installing this package (on the command line):
pip install plot2html
Python code:
# example data
import pandas as pd
temperature = pd.read_csv('https://raw.githubusercontent.com/rafatro/plot2html/main/tests/Temperature_London_Rome.csv',parse_dates=[0])

# date        location  tavg
# 2019-01-01  London    7.3
# 2019-01-02  London    3.7
# 2019-01-03  London    2.2
from plot2html import CreateReport
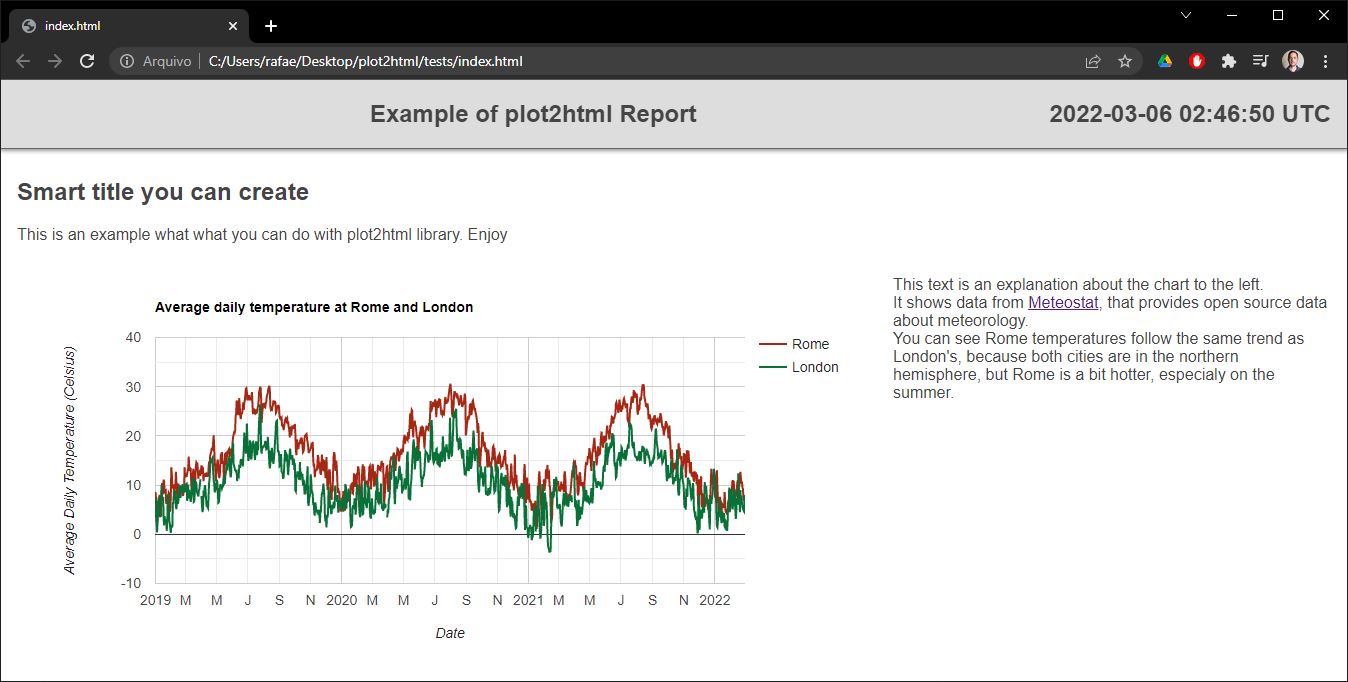
report = CreateReport("Example of plot2html Report")
report.text("<h2>Smart title you can create</h2>This is an example what what you can do with plot2html.")
options = {'title': 'Average temperature at London and Rome',
'hAxis': {'title': 'Date'},
'vAxis': {'title': 'Average Daily Temperature (Celsius)'},
'colors': ['#a52714', '#097138']
}
# We want a chart that shows each location as a different serie (each loacation should be a different line on the chart).
# Since the location is one column on the dataframe, we need to pivot the dataframe so each location becomes a column.
report.plot(data=temperature.pivot(index='date', columns='location', values='tavg').reset_index()
,x='date'
,y=['Rome','London']
,type='line'
,width='2-thirds'
,height=400
,options=options)
report.text('''This text is an explanation about the chart to the left.<br>
It shows data from <a href='https://meteostat.net/'>Meteostat</a>, that provides open source data about meteorology.<br>
You can see Rome temperatures follow the same trend as London's, because both cities are in the northern hemisphere, but Rome is a bit hotter, especialy on the summer.
''',width="third")
report.exporthtml("C:/Users/rafae/Desktop/plot2html/tests/index.html")
You will get this output:
Data: pandas DataFrame with the columns that are going to be used as either as the horizontal axis or the series of the chart.
x: name of the column that will be used as horizontal axis of the chart
y: name (or several names) of the columns that will be used as series of the chart.
type: either 'line' or 'column'. Other alternatives on development.
width: how much horizontal space of the screen is going to be occupied by the chart (or text). Possibilities: 'full' (default), 'half', 'third', '2-thirds' or 'quarter'.
height: height of the chart in pixels.
options: several parameters to be passed to Google Chart API, including title, axis title, colors, font size, annotations, gridlines, legend position etc. See all possibilities on Google Charts documentation site. But please note the notation is a bit different because requires the names of the parameters to be inside single quotes '. So, instead of options={hAxis:{title: 'Time',textStyle:{color: '#01579b',fontSize:20}}} use options={'hAxis':{'title': 'Time','textStyle':{'color': '#01579b','fontSize':20}}}
Any feedback is welcome. This is just the beginning.
FAQs
Creates a static .html file with charts using Google Charts API
We found that plot2html demonstrated a healthy version release cadence and project activity because the last version was released less than a year ago. It has 1 open source maintainer collaborating on the project.
Did you know?

Socket for GitHub automatically highlights issues in each pull request and monitors the health of all your open source dependencies. Discover the contents of your packages and block harmful activity before you install or update your dependencies.
Product
Add secure dependency scanning to Claude Desktop with Socket MCP, a one-click extension that keeps your coding conversations safe from malicious packages.
Product
Socket now supports Scala and Kotlin, bringing AI-powered threat detection to JVM projects with easy manifest generation and fast, accurate scans.

Application Security
/Security News
Socket CEO Feross Aboukhadijeh and a16z partner Joel de la Garza discuss vibe coding, AI-driven software development, and how the rise of LLMs, despite their risks, still points toward a more secure and innovative future.