Product
Introducing License Enforcement in Socket
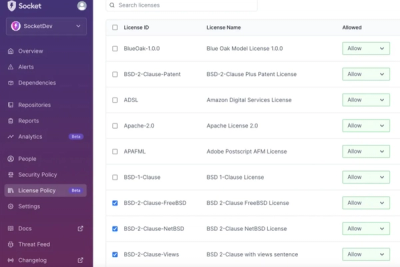
Ensure open-source compliance with Socket’s License Enforcement Beta. Set up your License Policy and secure your software!
By Philipp Burckhardt - Oct 17, 2024
Create compressed, interactive HTML reports with embedded Python code, custom JS and CSS, and wrappers for CanvasXpress plots, networks and more.
.. These are examples of badges you might want to add to your README: please update the URLs accordingly
.. image:: https://api.cirrus-ci.com/github/<USER>/py_report_html.svg?branch=main
:alt: Built Status
:target: https://cirrus-ci.com/github/<USER>/py_report_html
.. image:: https://readthedocs.org/projects/py_report_html/badge/?version=latest
:alt: ReadTheDocs
:target: https://py_report_html.readthedocs.io/en/stable/
.. image:: https://img.shields.io/coveralls/github/<USER>/py_report_html/main.svg
:alt: Coveralls
:target: https://coveralls.io/r/<USER>/py_report_html
.. image:: https://img.shields.io/pypi/v/py_report_html.svg
:alt: PyPI-Server
:target: https://pypi.org/project/py_report_html/
.. image:: https://img.shields.io/conda/vn/conda-forge/py_report_html.svg
:alt: Conda-Forge
:target: https://anaconda.org/conda-forge/py_report_html
.. image:: https://pepy.tech/badge/py_report_html/month
:alt: Monthly Downloads
:target: https://pepy.tech/project/py_report_html
.. image:: https://img.shields.io/twitter/url/http/shields.io.svg?style=social&label=Twitter
:alt: Twitter
:target: https://twitter.com/py_report_html
|
Create compressed, interactive HTML reports with embedded Python code, custom JS and CSS, and wrappers for CanvasXpress plots, networks and more.
py_report_html is a Python library designed for generating customizable HTML reports that can include a variety of data visualizations, tables, networks and potentially other types of interactive or static content. It supports data compression and extensibility through additional templates and web resources. The key advantage is the ability to embed Python code to control template flow execution, content rendering, and data modification on the go.
Key features and functionalities include:
Data Visualization Support: It integrates with several popular Python and Javascript libraries for data visualization, such as matplotlib and seaborn for static data visualization, CanvasXpress for dynamic data visualization, and Cytoscape, Elgrapho, Sigma and Pyvis for static and dynamic visualization of graph-based data structures. Additionally, it supports MermaidJS for flowcharts and diagrams.
Template-Based Report Generation: Allows users to define custom HTML templates for their reports, providing flexibility and customization.
Compression Option: Optionally compresses report data to reduce the size of the final report, making it easier to share, store, and render in a web browser.
Flexible Data Handling: Generates reports based on tables directly loaded from files using the main binary, "py_report_html". Alternatively, users can load and transform data using py_report_html as a library for deeper control.
Extensibility: Highly extensible, allowing users to include additional JavaScript libraries, CSS stylesheets, and nested templates to further customize their reports.
For an equivalent R library, please visit htmlreportR on GitHub (https://github.com/AEstebanMar/htmlreportR).
FAQs
Create compressed, interactive HTML reports with embedded Python code, custom JS and CSS, and wrappers for CanvasXpress plots, networks and more.
We found that py-report-html demonstrated a healthy version release cadence and project activity because the last version was released less than a year ago. It has 1 open source maintainer collaborating on the project.
Did you know?

Socket for GitHub automatically highlights issues in each pull request and monitors the health of all your open source dependencies. Discover the contents of your packages and block harmful activity before you install or update your dependencies.
Product
Ensure open-source compliance with Socket’s License Enforcement Beta. Set up your License Policy and secure your software!
Product
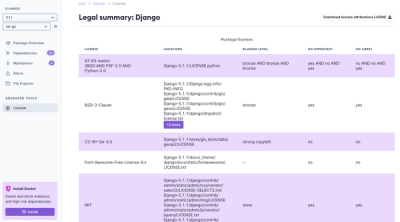
We're launching a new set of license analysis and compliance features for analyzing, managing, and complying with licenses across a range of supported languages and ecosystems.
Product
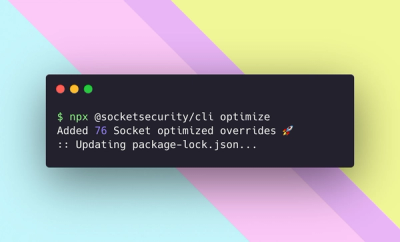
We're excited to introduce Socket Optimize, a powerful CLI command to secure open source dependencies with tested, optimized package overrides.